Note
Go to the end to download the full example code
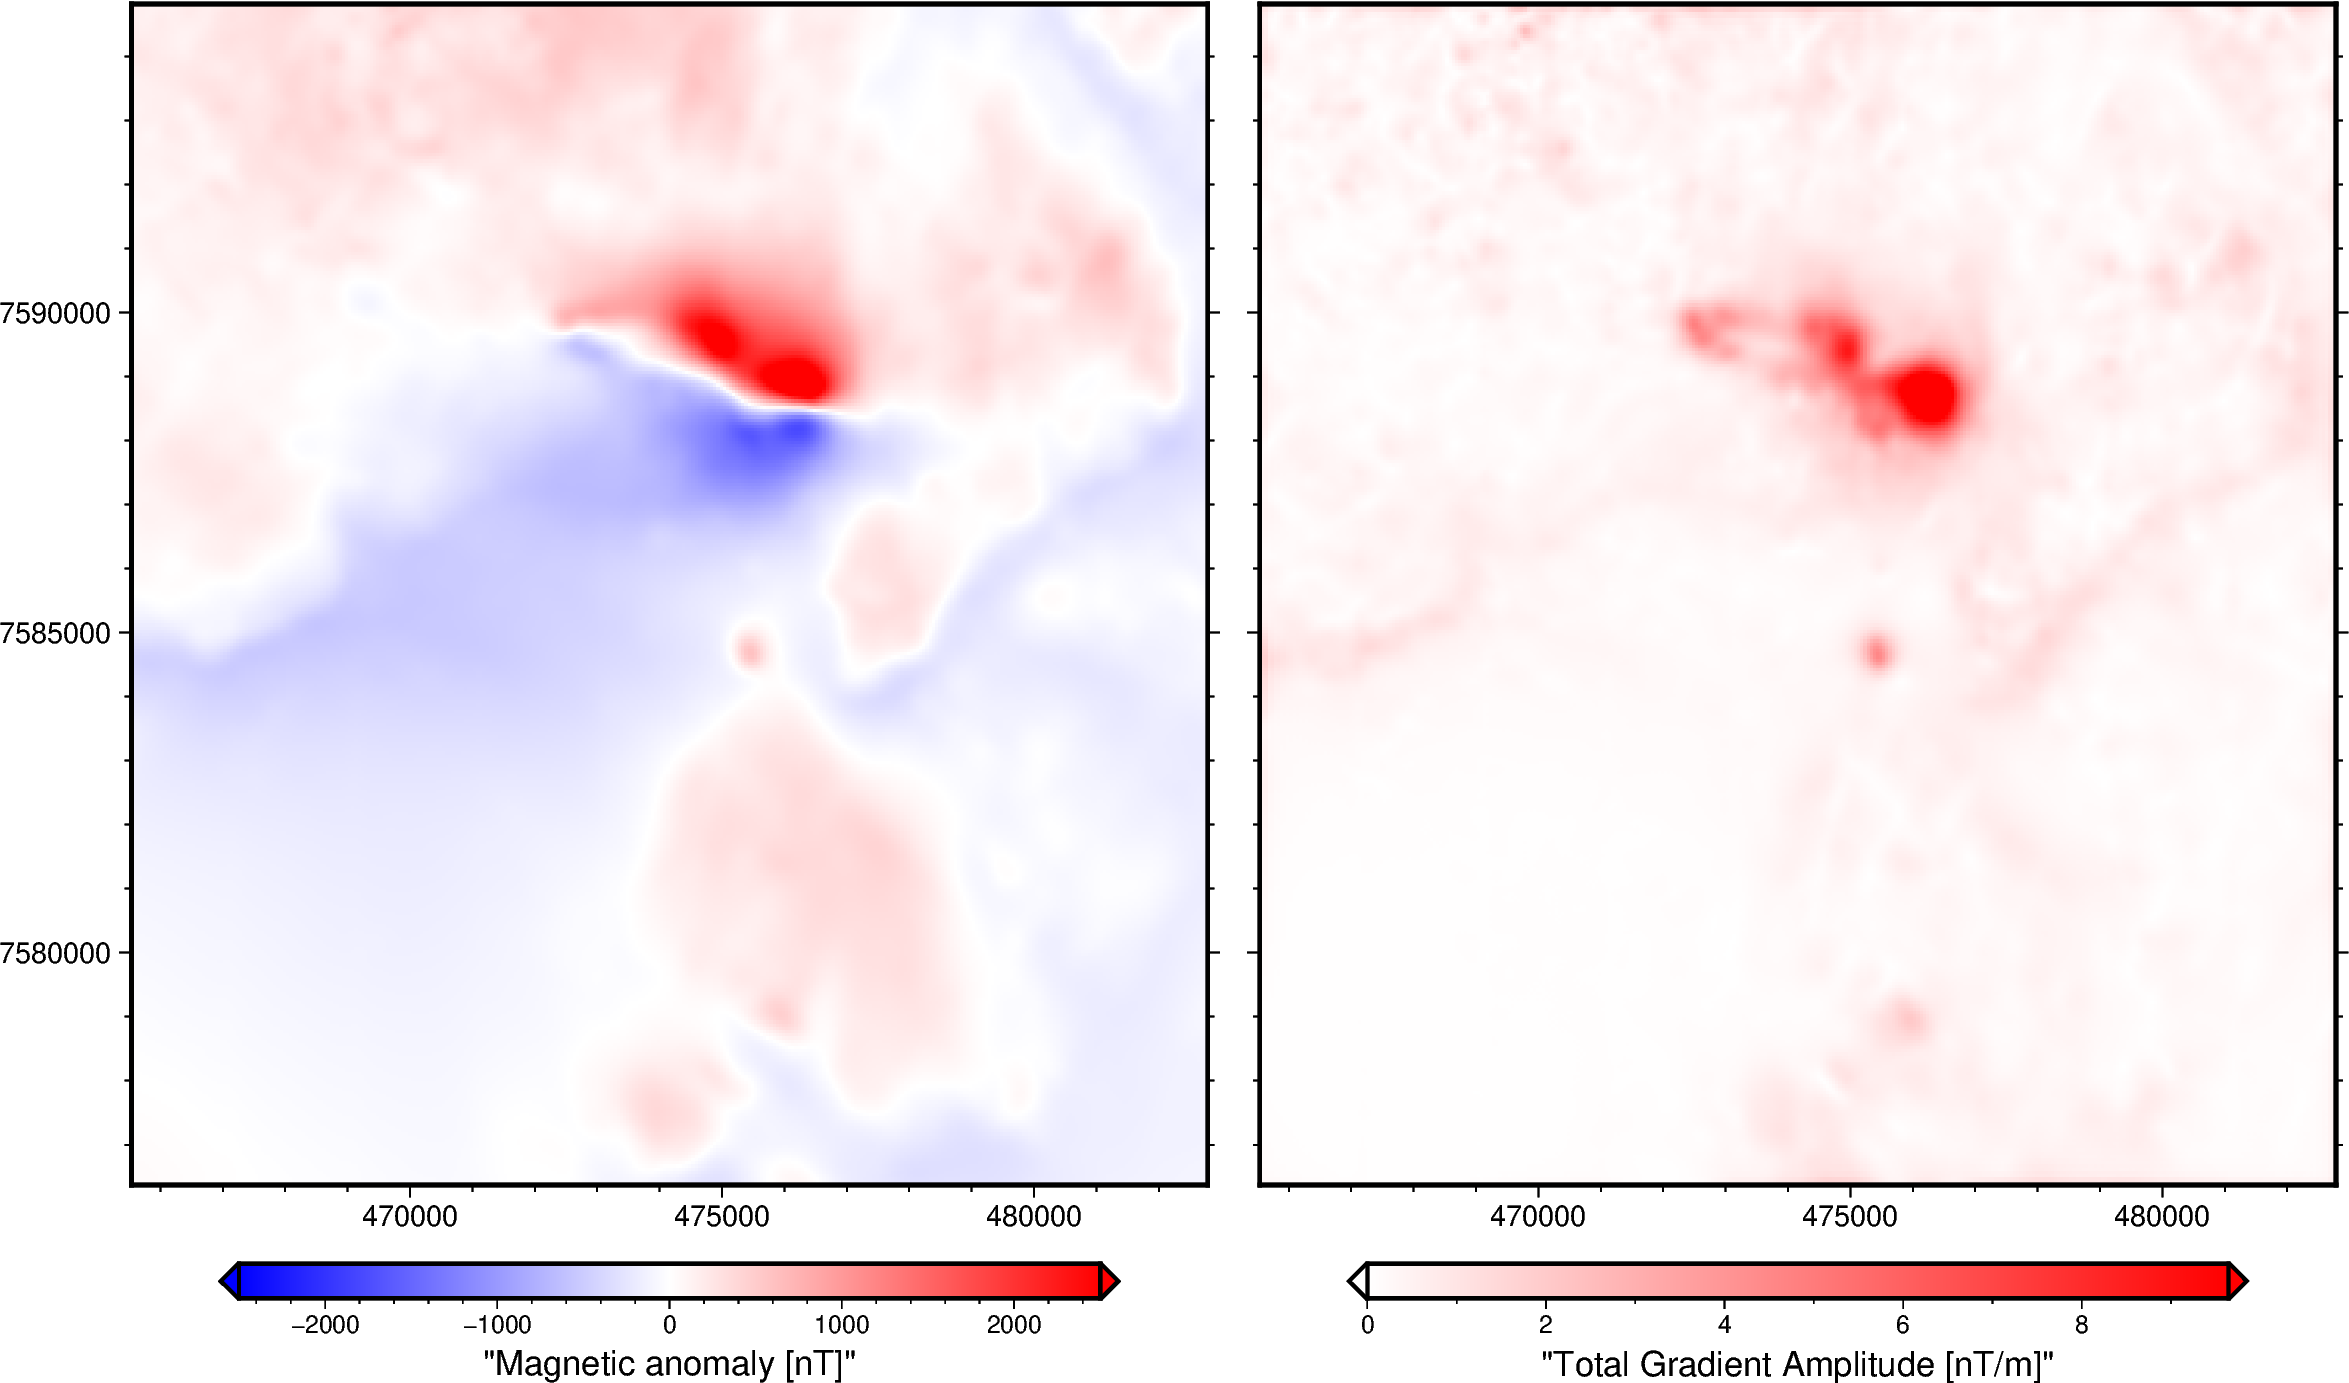
Total gradient amplitude of a regular grid#
Total Gradient Amplitude:
 <xarray.DataArray (northing: 370, easting: 346)> Size: 1MB
array([[0.03861836, 0.04455406, 0.04407794, ..., 0.05025985, 0.04814695,
        0.05978932],
       [0.04940621, 0.07371739, 0.07236767, ..., 0.03644512, 0.03543132,
        0.04679314],
       [0.04790018, 0.07587627, 0.07681641, ..., 0.0360322 , 0.03660584,
        0.04383785],
       ...,
       [0.32439862, 0.23297194, 0.22328171, ..., 0.58808784, 0.53799461,
        0.63361113],
       [0.32348286, 0.23442257, 0.21816776, ..., 0.63367356, 0.59349298,
        0.70340967],
       [0.23963734, 0.19502693, 0.20263021, ..., 0.61247388, 0.53729494,
        0.60943501]], shape=(370, 346))
Coordinates:
  * northing  (northing) float64 3kB 7.576e+06 7.576e+06 ... 7.595e+06 7.595e+06
  * easting   (easting) float64 3kB 4.655e+05 4.656e+05 ... 4.827e+05 4.828e+05
    height    (northing, easting) float64 1MB 500.0 500.0 500.0 ... 500.0 500.0
import ensaio
import pygmt
import verde as vd
import xarray as xr

import harmonica as hm

# Fetch magnetic grid over the Lightning Creek Sill Complex, Australia using
# Ensaio and load it with Xarray
fname = ensaio.fetch_lightning_creek_magnetic(version=1)
magnetic_grid = xr.load_dataarray(fname)

# Compute the total gradient amplitude of the grid
tga = hm.total_gradient_amplitude(magnetic_grid)
# Show the total gradient amplitude
print("\nTotal Gradient Amplitude:\n", tga)

# Plot original magnetic anomaly and the total gradient amplitude
fig = pygmt.Figure()
with fig.subplot(nrows=1, ncols=2, figsize=("28c", "15c"), sharey="l"):
    with fig.set_panel(panel=0):
        # Make colormap of data
        scale = 2500
        pygmt.makecpt(cmap="polar+h", series=[-scale, scale], background=True)
        # Plot magnetic anomaly grid
        fig.grdimage(
            grid=magnetic_grid,
            projection="X?",
            cmap=True,
        )
        # Add colorbar
        fig.colorbar(
            frame='af+l"Magnetic anomaly [nT]"',
            position="JBC+h+o0/1c+e",
        )
    with fig.set_panel(panel=1):
        # Make colormap for total gradient amplitude (saturate it a little bit)
        scale = 0.6 * vd.maxabs(tga)
        pygmt.makecpt(cmap="polar+h", series=[0, scale], background=True)
        # Plot total gradient amplitude
        fig.grdimage(grid=tga, projection="X?", cmap=True)
        # Add colorbar
        fig.colorbar(
            frame='af+l"Total Gradient Amplitude [nT/m]"',
            position="JBC+h+o0/1c+e",
        )
fig.show()
Total running time of the script: (0 minutes 0.395 seconds)