Note
Go to the end to download the full example code
Layer of tesseroids#
import boule as bl
import ensaio
import numpy as np
import pygmt
import verde as vd
import xarray as xr
import harmonica as hm
fname = ensaio.fetch_earth_topography(version=1)
topo = xr.load_dataarray(fname)
region = (-78, -53, -57, -20)
topo = topo.sel(latitude=slice(*region[2:]), longitude=slice(*region[:2]))
ellipsoid = bl.WGS84
longitude, latitude = np.meshgrid(topo.longitude, topo.latitude)
# Compute radius of WGS84 ellipsoid at each lat/lon coordinates
reference = ellipsoid.geocentric_radius(latitude)
# Compute surface topography with respect to the center of the Earth
surface = topo + reference
# tesseroids above sea level have density of 2670 kg/m³ and tesseroids located below sea
# level have density of -1630 kg/m³
density = xr.where(topo > 0, 2670.0, 1040.0 - 2670.0)
# Create a layer of tesseroids representing the topography
# These have tops and bottoms defined by Earth's topography with respect to the center
# of the Earth.
tesseroids = hm.tesseroid_layer(
coordinates=(topo.longitude, topo.latitude),
surface=surface,
reference=reference,
properties={"density": density},
)
# Create a regular grid of computation points located at 10km above reference
grid_longitude, grid_latitude = vd.grid_coordinates(region=region, spacing=0.5)
grid_radius = ellipsoid.geocentric_radius(grid_latitude) + 10e3
grid_coords = (grid_longitude, grid_latitude, grid_radius)
# Compute gravity field of tesseroids on a regular grid of observation points
gravity = tesseroids.tesseroid_layer.gravity(grid_coords, field="g_z")
gravity = vd.make_xarray_grid(
grid_coords,
gravity,
data_names="g_z",
dims=("latitude", "longitude"),
extra_coords_names="radius",
)
fig = pygmt.Figure()
# Plot tesseroid thickness
fig.grdimage(
tesseroids.top - tesseroids.bottom,
projection="M15c",
nan_transparent=True,
cmap="viridis",
frame="+tTesseroid thickness",
)
fig.basemap(frame=True)
fig.colorbar(frame="af+lthickness (m)")
fig.coast(shorelines="0.5p,black", borders=["1/0.5p,black"])
fig.shift_origin(xshift="17c")
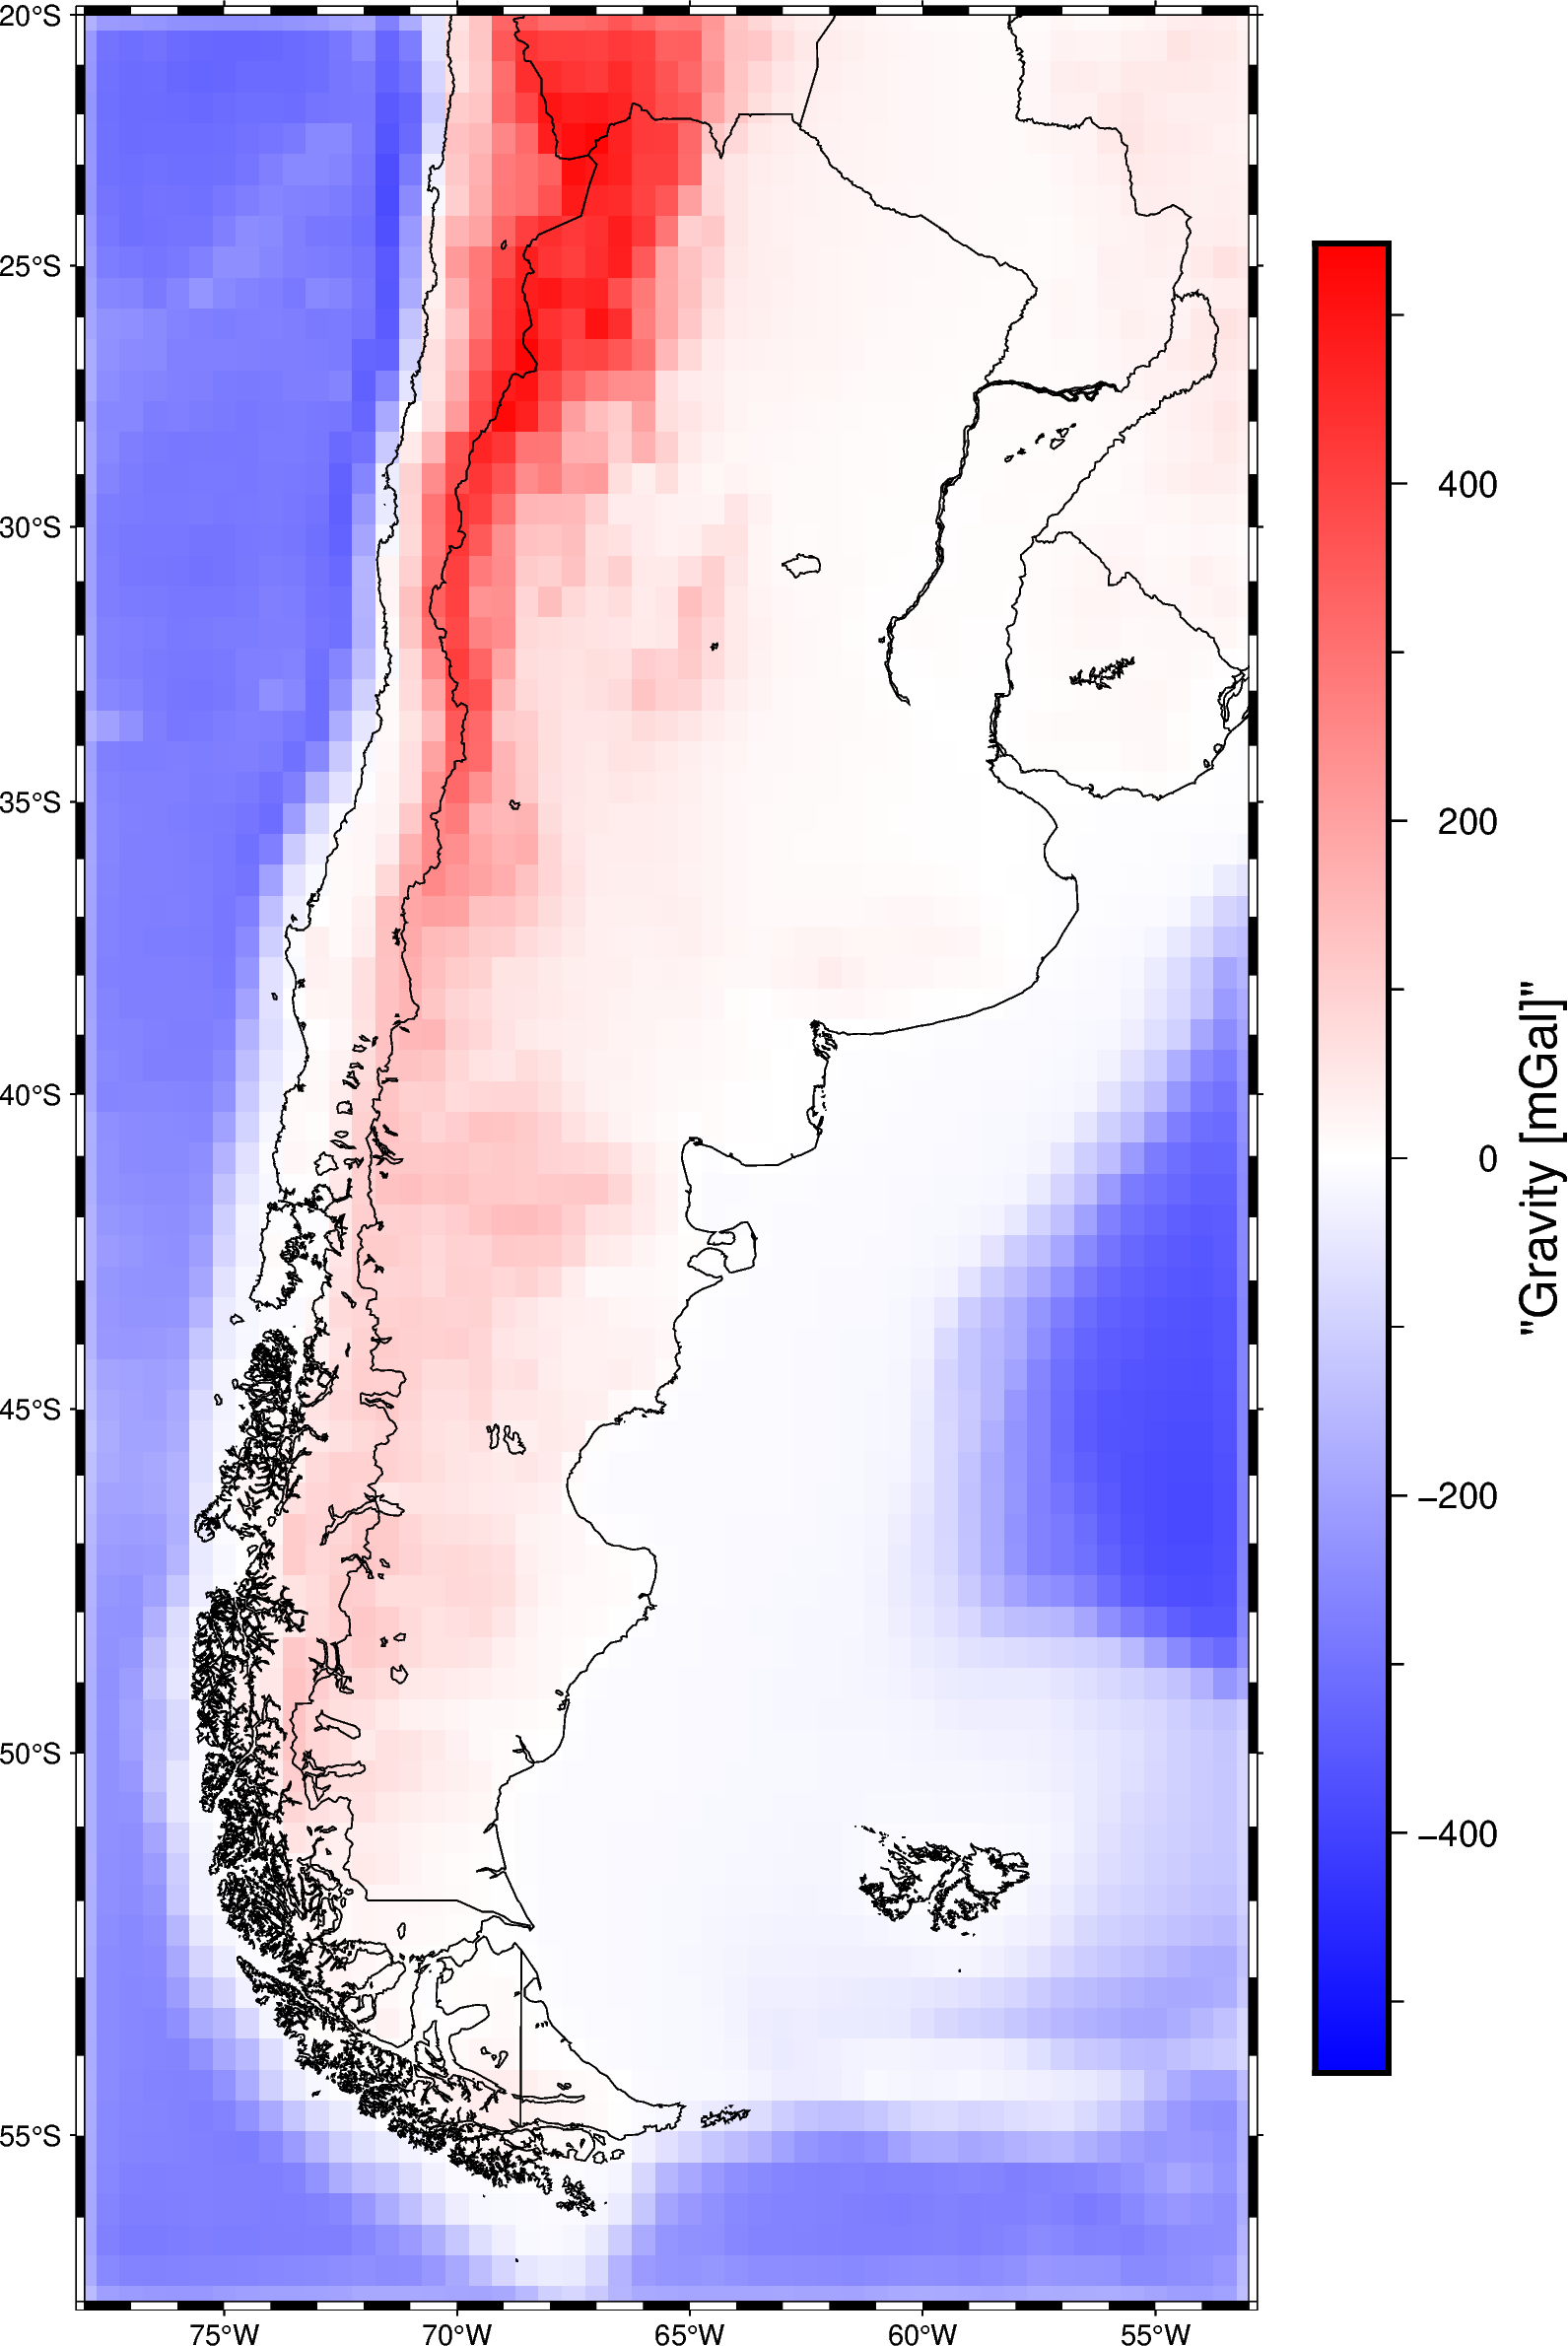
# Plot gravity field
maxabs = vd.maxabs(gravity.g_z)
pygmt.makecpt(cmap="balance+h0", series=(-maxabs, maxabs))
fig.grdimage(
gravity.g_z,
projection="M15c",
nan_transparent=True,
frame="+tForward gravity",
)
fig.basemap(frame=True)
fig.colorbar(frame="af+lGravity (mGal)")
fig.coast(shorelines="0.5p,black", borders=["1/0.5p,black"])
fig.show()
Total running time of the script: (0 minutes 24.523 seconds)