Note
Go to the end to download the full example code
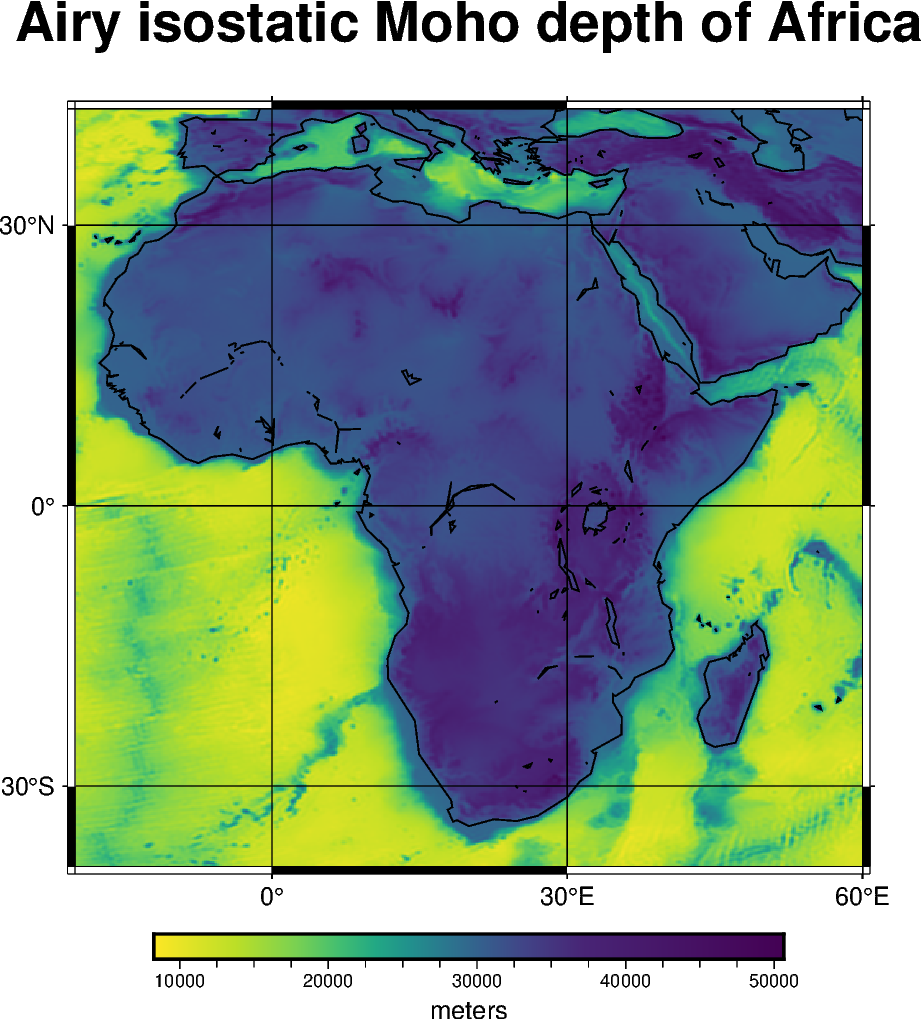
Airy Isostatic Moho#
According to the Airy hypothesis of isostasy, topography above sea level is
supported by a thickening of the crust (a root) while oceanic basins are
supported by a thinning of the crust (an anti-root). Function
harmonica.isostatic_moho_airy computes the depth to crust-mantle
interface (the Moho) according to Airy isostasy. The function takes the depth
to the crystalline basement and optionally any layers on top of it. Each layer
is defined by its thickness and its density. In addition, one must assume
a value for the reference thickness of the continental crust in order to
convert the root/anti-root thickness into Moho depth. The function contains
common default values for the reference thickness and crust, mantle
[TurcotteSchubert2014].
We’ll use our sample topography data
(ensaio.fetch_earth_topography) to calculate the Airy
isostatic Moho depth of Africa.
Topography/bathymetry grid:
<xarray.Dataset> Size: 2MB
Dimensions:     (latitude: 511, longitude: 481)
Coordinates:
  * latitude    (latitude) float64 4kB -40.0 -39.83 -39.67 ... 44.67 44.83 45.0
  * longitude   (longitude) float64 4kB -20.0 -19.83 -19.67 ... 59.67 59.83 60.0
Data variables:
    topography  (latitude, longitude) float64 2MB -3.528e+03 -3.51e+03 ... 33.0

Moho depth grid:
<xarray.DataArray 'moho_depth' (latitude: 511, longitude: 481)> Size: 2MB
array([[17510.88, 17574.6 , 17712.66, ..., 11715.9 , 11602.62, 11443.32],
       [17833.02, 17942.76, 18165.78, ..., 11609.7 , 11581.38, 11461.02],
       [17684.34, 17797.62, 18034.8 , ..., 11503.5 , 11570.76, 11521.2 ],
       ...,
       [15167.4 , 15202.8 , 14937.3 , ..., 30151.2 , 30184.8 , 30184.8 ],
       [15347.94, 15503.7 , 15266.52, ..., 30145.6 , 30184.8 , 30184.8 ],
       [15362.1 , 15517.86, 15252.36, ..., 30151.2 , 30173.6 , 30184.8 ]],
      shape=(511, 481))
Coordinates:
  * latitude   (latitude) float64 4kB -40.0 -39.83 -39.67 ... 44.67 44.83 45.0
  * longitude  (longitude) float64 4kB -20.0 -19.83 -19.67 ... 59.67 59.83 60.0
Attributes: (12/16)
    Conventions:     CF-1.8
    title:           Topographic and bathymetric height of ETOPO1 (ice surfac...
    crs:             WGS84
    source:          Generated from a spherical harmonic model by the ICGEM C...
    license:         public domain
    references:      https://doi.org/10.7289/V5C8276M
    ...              ...
    actual_range:    [-10023.   6082.]
    icgem_metadata:  generating_institute: gfz-potsdam\ngenerating_date: 2021...
    isostasy:        Airy
    density_crust:   2800.0
    density_mantle:  3300.0
    density_water:   1030
import ensaio
import numpy as np
import pygmt
import xarray as xr

import harmonica as hm

# Load the elevation model and cut out the portion of the data corresponding to
# Africa
fname = ensaio.fetch_earth_topography(version=1)
data = xr.load_dataset(fname)
region = (-20, 60, -40, 45)
data_africa = data.sel(latitude=slice(*region[2:]), longitude=slice(*region[:2]))
print("Topography/bathymetry grid:")
print(data_africa)

# Calculate the water thickness
oceans = np.array(data_africa.topography < 0)
water_thickness = data_africa.topography * oceans * -1
water_density = 1030

# Calculate the isostatic Moho depth using the default values for densities and
# reference Moho with water load. We neglect the effect of sediment here, so
# basement elevation refers to topography.
moho = hm.isostatic_moho_airy(
    basement=data_africa.topography,
    layers={"water": (water_thickness, water_density)},
)
print("\nMoho depth grid:")
print(moho)

# Draw the maps
fig = pygmt.Figure()

pygmt.grd2cpt(grid=moho, cmap="viridis", reverse=True, continuous=True)

title = "Airy isostatic Moho depth of Africa"

fig.grdimage(
    region=region,
    projection="Y20/0/10c",
    frame=["ag", f"+t{title}"],
    grid=moho,
    cmap=True,
)

fig.coast(shorelines="0.5p,black", resolution="crude")

fig.colorbar(cmap=True, frame=["a10000f2500", "x+lmeters"])

fig.show()
Total running time of the script: (0 minutes 0.388 seconds)