Magnetic dipoles#
We can compute the magnetic field generated by dipole sources through
the harmonica.dipole_magnetic function.
Each dipole can be defined as a tuple containing its coordinates in the following order: easting, northing, upward (in Cartesian coordinates and in meters).
Let’s define a single dipole and compute the magnetic field it generates on a computation point above it.
Define the dipole and its magnetic moment vector:
dipole = (20, 40, -50)
magnetic_moment = (100, 100, 100)
Define the observation point above it:
coordinates = (20, 40, 10)
And compute the three components of the magnetic field the dipole generates by
choosing field="b":
b_e, b_n, b_u = hm.dipole_magnetic(coordinates, dipole, magnetic_moment, field="b")
print(b_e, b_n, b_u)
-0.04629629632149888 -0.04629629632149888 0.09259259264299775
We can compute just a single component with field set to "b_e",
"b_n" or "b_u":
b_u = hm.dipole_magnetic(
   coordinates, dipole, magnetic_moment, field="b_u"
)
print(b_u)
0.09259259264299775
Multiple dipoles#
We can also use this function to compute the magnetic fields of multiple dipoles on multiple observation points.
Let’s define a regular grid of observation points:
import bordado as bd

region = (-100, 100, -100, 100)
spacing = 1
height = 0
coordinates = bd.grid_coordinates(
   region=region, spacing=spacing, non_dimensional_coords=height
)
And a set of dipoles with their magnetic moments:
import numpy as np

easting = [25, 35, -30, -50]
northing = [3, -38, 22, -30]
upward = [-200, -100, -300, -150]
dipoles = (easting, northing, upward)

mag_e = [1e3, 2e3, 500, 2e3]
mag_n = [1e3, 2e3, 500, 2e3]
mag_u = [1e3, 2e3, 500, 2e3]
magnetic_moments = (mag_e, mag_n, mag_u)
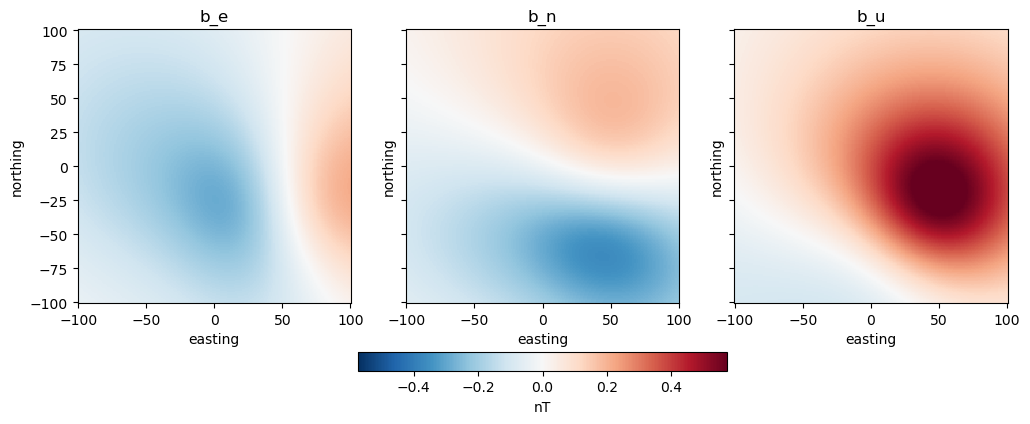
Now, let’s compute the magnetic field components that the dipoles generate on every observation point:
b_e, b_n, b_u = hm.dipole_magnetic(coordinates, dipoles, magnetic_moments, field="b")
We can reshape the results into variables of an dataset:
import verde as vd

grid = vd.make_xarray_grid(
   coordinates,
   data=(b_e, b_n, b_u),
   data_names=["b_e", "b_n", "b_u"],
   extra_coords_names="extra"
)
import matplotlib.pyplot as plt

fig, axes = plt.subplots(nrows=1, ncols=3, sharey=True, figsize=(12, 8))

maxabs = vd.maxabs(*[grid[v] for v in grid.variables], percentile=99)
for field, ax in zip(grid.variables, axes):
   tmp = grid[field].plot(
      ax=ax,
      add_colorbar=False,
      vmin=-maxabs,
      vmax=maxabs,
      cmap='RdBu_r',
   )
   ax.set_aspect("equal")
   ax.set_title(field)
fig.colorbar(tmp, ax=axes.ravel().tolist(), orientation="horizontal", label="nT", fraction=.03, pad=0.08)
plt.show()