Note
Go to the end to download the full example code
Tesseroids (spherical prisms)#
Computing the gravitational fields generated by regional or global scale
structures require to take into account the curvature of the Earth. One common
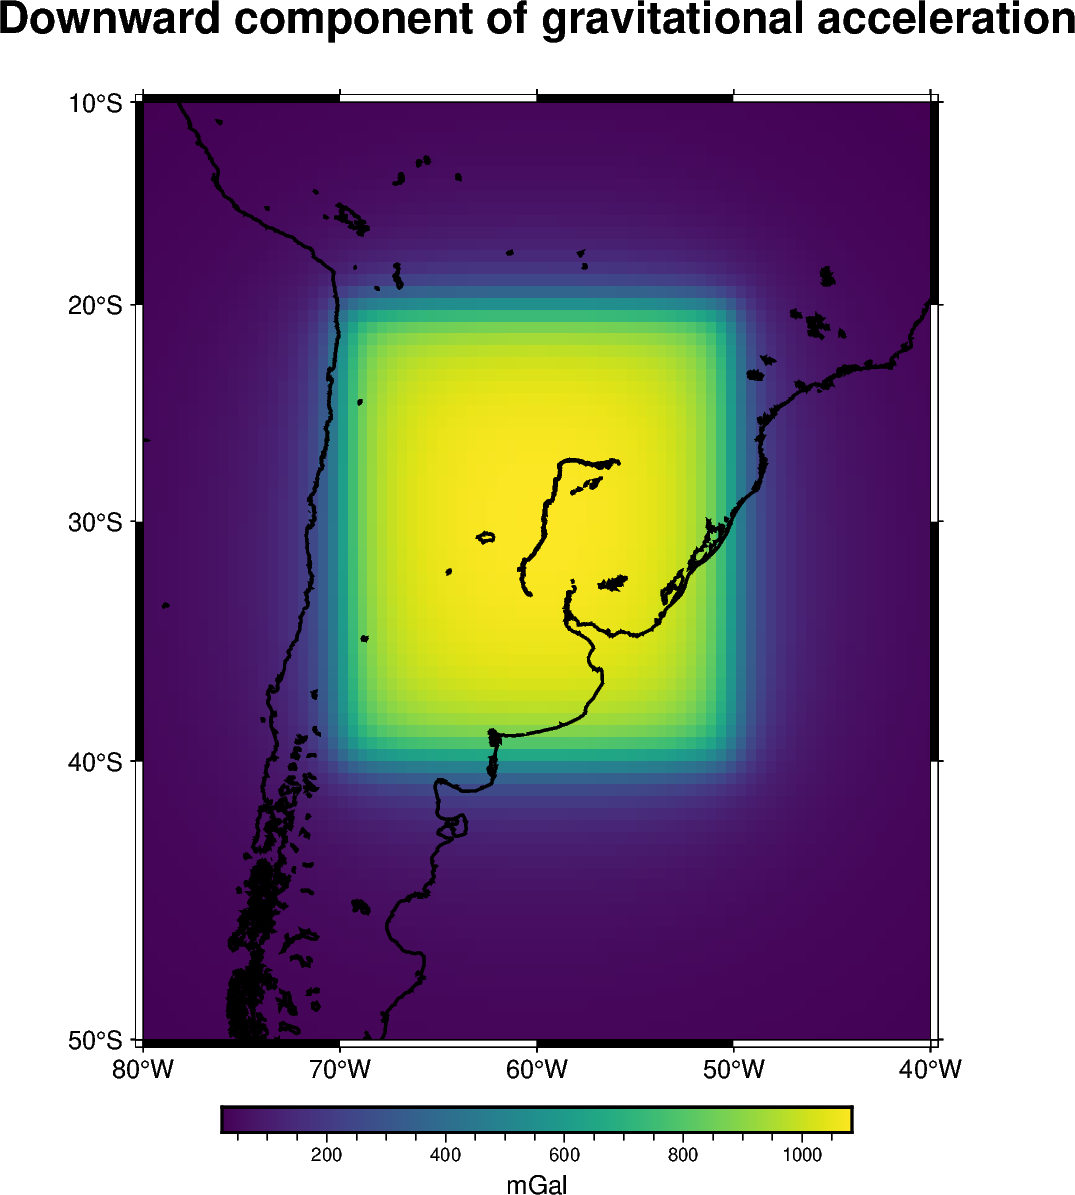
approach is to use spherical prisms also known as tesseroids. We will compute
the downward component of the gravitational acceleration generated by a single
tesseroid on a computation grid through the harmonica.tesseroid_gravity
function.
[[26.2577662  26.62129492 26.99021011 ... 26.99021011 26.62129492
  26.2577662 ]
 [26.82675451 27.21873923 27.6174152  ... 27.6174152  27.21873923
  26.82675451]
 [27.41566113 27.83864994 28.2698843  ... 28.2698843  27.83864994
  27.41566113]
 ...
 [24.38760516 24.84348805 25.31327842 ... 25.31327842 24.84348805
  24.38760516]
 [23.90559035 24.33514689 24.77681359 ... 24.77681359 24.33514689
  23.90559035]
 [23.43940226 23.84446608 24.26006767 ... 24.26006767 23.84446608
  23.43940226]]
import boule as bl
import pygmt
import verde as vd

import harmonica as hm

# Use the WGS84 ellipsoid to obtain the mean Earth radius which we'll use to
# reference the tesseroid
ellipsoid = bl.WGS84

# Define tesseroid with top surface at the mean Earth radius, thickness of 10km
# (bottom = top - thickness) and density of 2670kg/m^3
tesseroid = [-70, -50, -40, -20, ellipsoid.mean_radius - 10e3, ellipsoid.mean_radius]
density = 2670

# Define computation points on a regular grid at 100km above the mean Earth
# radius
coordinates = vd.grid_coordinates(
    region=[-80, -40, -50, -10],
    shape=(80, 80),
    extra_coords=100e3 + ellipsoid.mean_radius,
)

# Compute the radial component of the acceleration
gravity = hm.tesseroid_gravity(coordinates, tesseroid, density, field="g_z")
print(gravity)
grid = vd.make_xarray_grid(
    coordinates, gravity, data_names="gravity", extra_coords_names="extra"
)

# Plot the gravitational field
fig = pygmt.Figure()

title = "Gravitational acceleration of a tesseroid"

with pygmt.config(FONT_TITLE="16p"):
    fig.grdimage(
        region=[-80, -40, -50, -10],
        projection="M-60/-30/10c",
        grid=grid.gravity,
        frame=["a", f"+t{title}"],
        cmap="viridis",
    )

# Plot edges of tesseroid
fig.plot(
    x=[tesseroid[0], tesseroid[1], tesseroid[1], tesseroid[0], tesseroid[0]],
    y=[tesseroid[2], tesseroid[2], tesseroid[3], tesseroid[3], tesseroid[2]],
    pen="1p,red",
    label="Tesseroid boundaries",
)

fig.legend()

fig.colorbar(cmap=True, position="JMR", frame=["a200f50", "x+lmGal"])

fig.coast(shorelines="1p,black")

fig.show()
Total running time of the script: (0 minutes 4.759 seconds)