Gravity Disturbance#
Gravity disturbances are the differences between the measured gravity and a reference (normal) gravity produced by an ellipsoid:
Where \(\delta g\) is the gravity disturbance, \(g\) the measured gravity, \(\gamma\) is the normal gravity and \(\mathbf{p}\) is the observation point where the gravity measurement has been carried out. The disturbances are what allows geoscientists to infer the internal structure of the Earth.
Tip
The measured gravity \(g\) is defined as the module of the gravity acceleration, i.e. the module of the gradient of Earth’s gravity potential \(W\), which includes both the gravitational potential \(V\) (due to the gravitational attraction of the masses that composes the Earth) and the centrifugal potential \(\Phi\) due to Earth’s rotation
Tip
The normal gravity \(\gamma\) is defined as the gradient of the potential gravity field generated by the reference ellipsoid \(U\) composed by the sum of the gravitational field \(V_\text{ell}\) and the centrifugal potential \(\Phi\):
See also
See [Hofmann-WellenhofMoritz2006] for detailed explainations of Earth gravity and the definition of its gravity and gravitational potentials.
We can compute the normal gravity generated by any ellipsoid through the
boule.Ellipsoid.normal_gravity method from boule and then use it
to compute gravity disturbances.
Lets start by loading a sample gravity dataset for the whole Earth:
import ensaio
import xarray as xr

fname = ensaio.fetch_earth_gravity(version=1)
gravity = xr.load_dataarray(fname)
print(gravity)
<xarray.DataArray 'gravity' (latitude: 1081, longitude: 2161)> Size: 19MB
array([[980106.525, 980106.525, 980106.525, ..., 980106.525, 980106.525,
        980106.525],
       [980108.225, 980108.225, 980108.225, ..., 980108.225, 980108.225,
        980108.225],
       [980108.825, 980108.825, 980108.825, ..., 980108.725, 980108.725,
        980108.825],
       ...,
       [980153.825, 980153.725, 980153.625, ..., 980153.925, 980153.825,
        980153.825],
       [980160.425, 980160.425, 980160.425, ..., 980160.425, 980160.425,
        980160.425],
       [980157.525, 980157.525, 980157.525, ..., 980157.525, 980157.525,
        980157.525]], shape=(1081, 2161))
Coordinates:
  * latitude   (latitude) float64 9kB -90.0 -89.83 -89.67 ... 89.67 89.83 90.0
  * longitude  (longitude) float64 17kB -180.0 -179.8 -179.7 ... 179.8 180.0
    height     (latitude, longitude) float32 9MB 1e+04 1e+04 ... 1e+04 1e+04
Attributes:
    Conventions:     CF-1.8
    title:           Gravity acceleration (EIGEN-6C4) at a constant geometric...
    crs:             WGS84
    source:          Generated from the EIGEN-6C4 model by the ICGEM Calculat...
    license:         Creative Commons Attribution 4.0 International Licence
    references:      https://doi.org/10.5880/icgem.2015.1
    long_name:       gravity acceleration
    description:     magnitude of the gravity acceleration vector (gravitatio...
    units:           mGal
    actual_range:    [974748.6 980201.9]
    icgem_metadata:  generating_institute: gfz-potsdam\ngenerating_date: 2021...
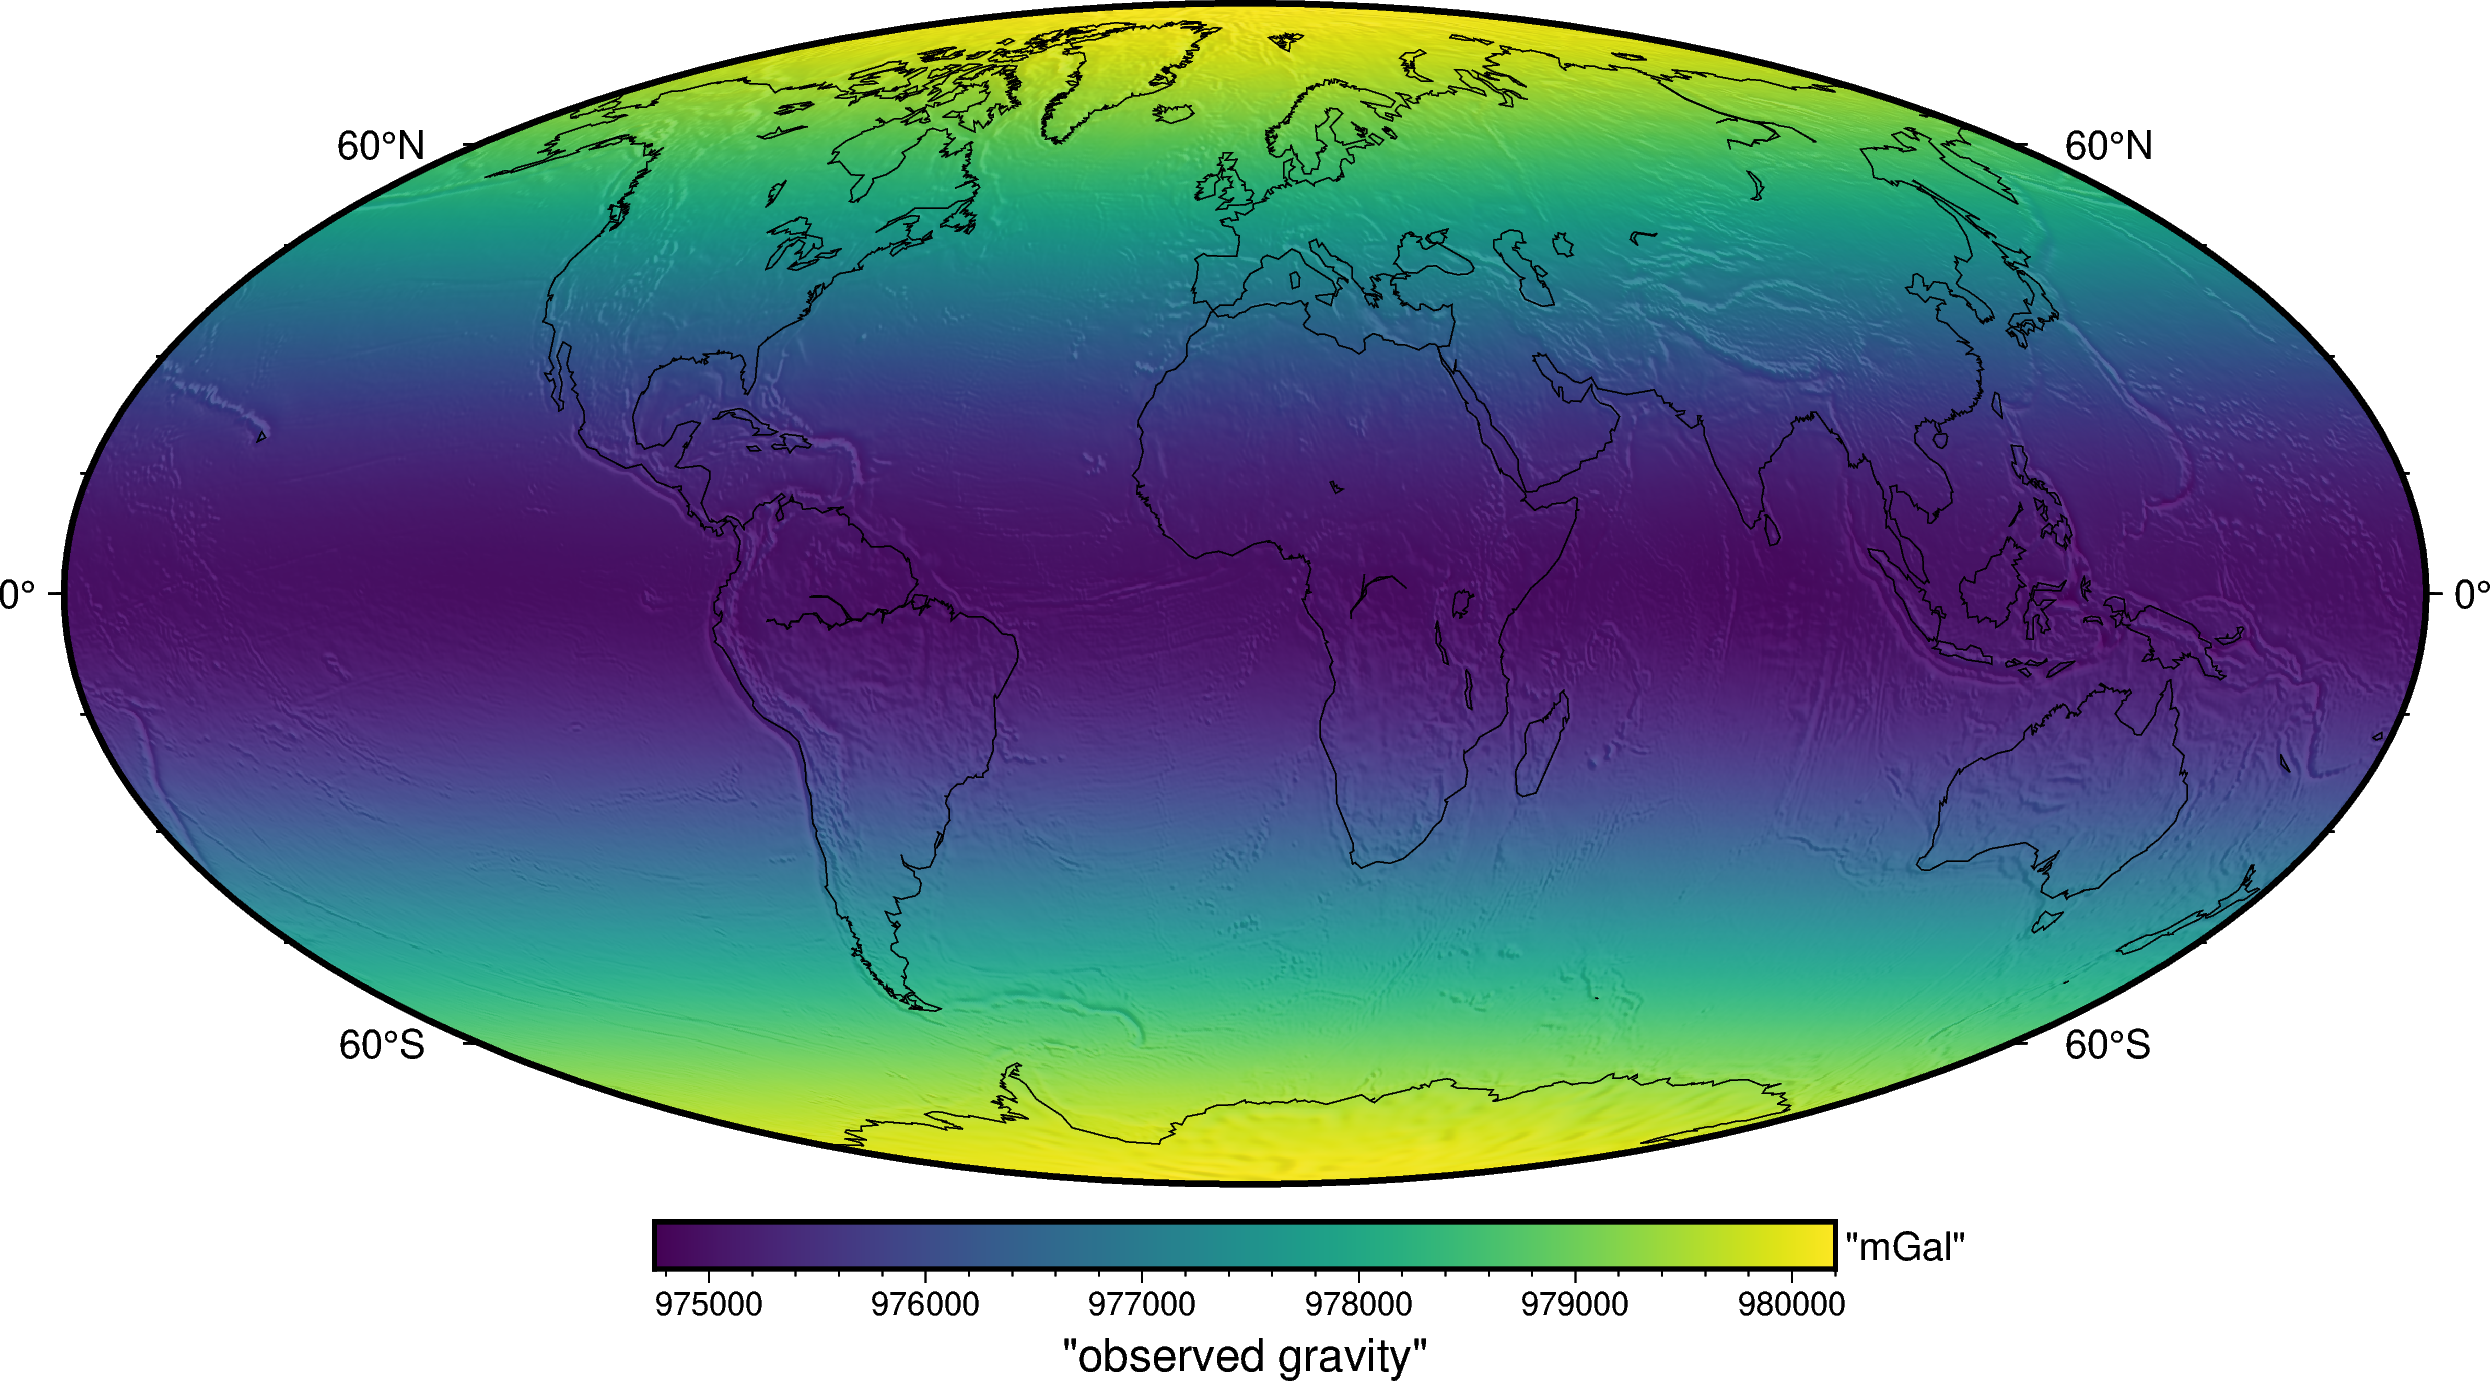
These observations are located on a regular grid on geodetic coordinates at the same height of 10 km above the reference ellipsoid. Lets plot it:
import pygmt

fig = pygmt.Figure()
fig.grdimage(
    gravity,
    projection="W20c",
    cmap="viridis",
    shading="+a45+nt0.2",
)
fig.basemap(frame=["af", "WEsn"])
fig.colorbar(
    position="JCB+w10c",
    frame=["af", 'y+l"mGal"', 'x+l"observed gravity"'],
)
fig.coast(shorelines=True, resolution="c", area_thresh=1e4)
fig.show()
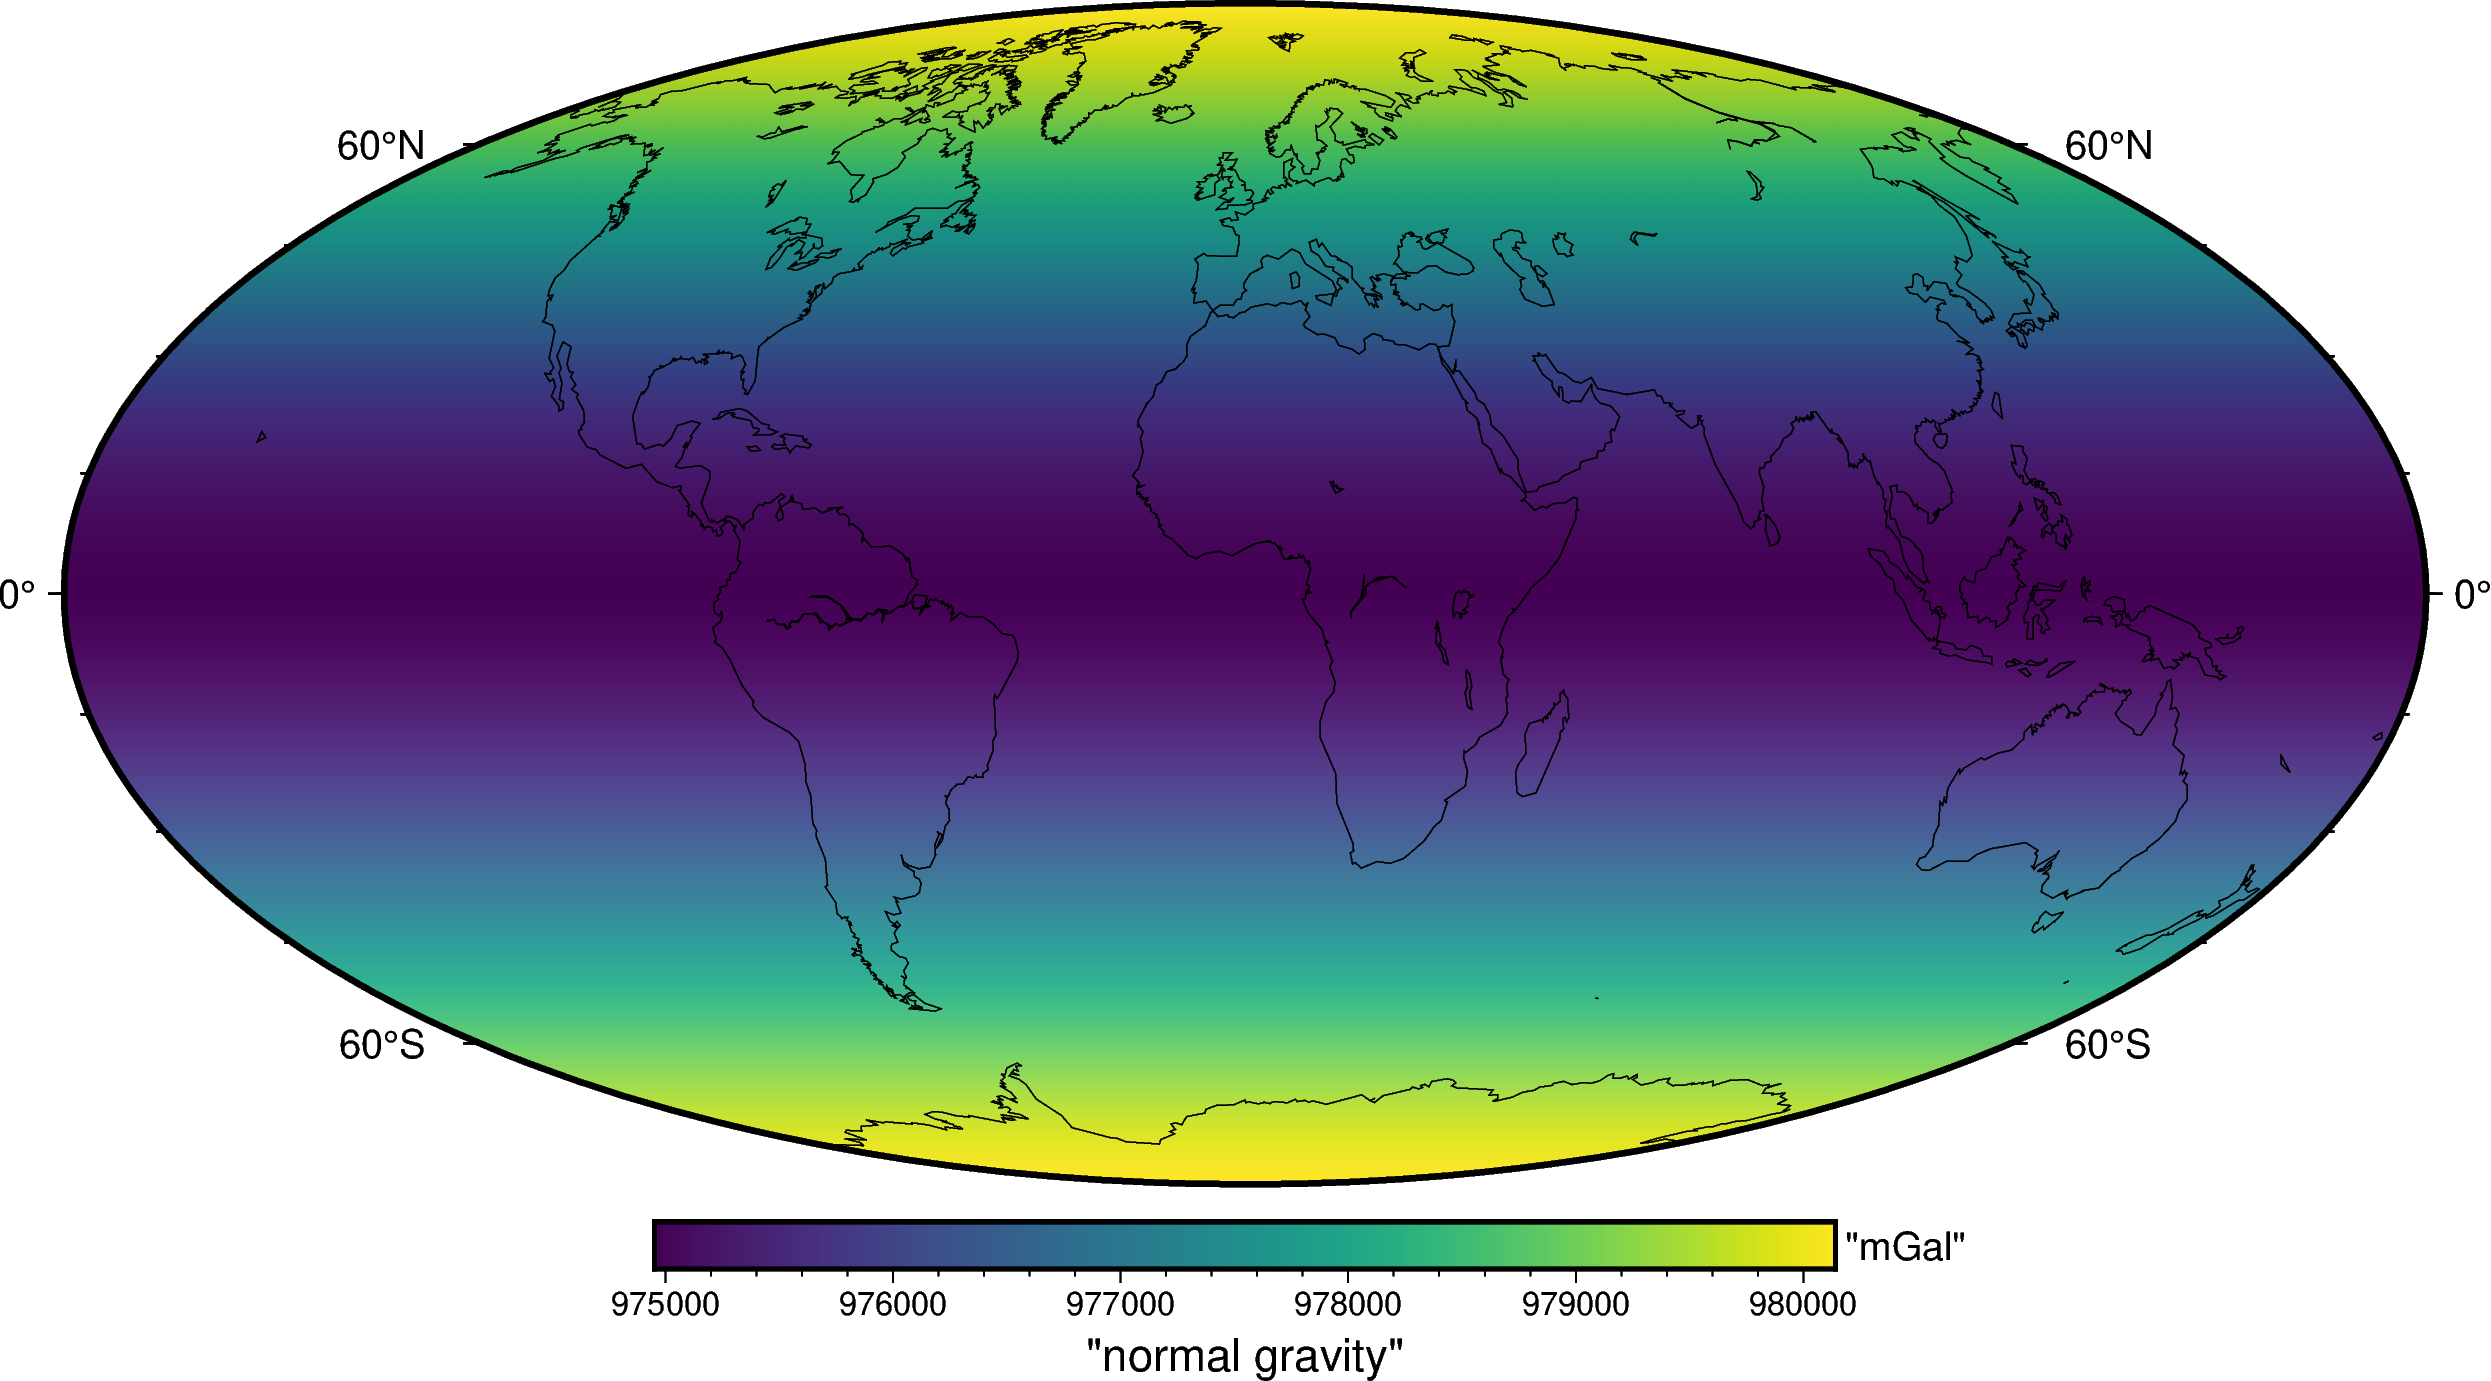
We can then get the WGS84 ellipsoid defined in boule and use the
boule.Ellipsoid.normal_gravity to compute the normal gravity (the
gravity acceleration generated by the ellipsoid) on every observation point.
This method implements the closed-form formula of [LiGotze2001], which
calculates the normal gravity at any latitude and (geometric) height through an
analytic solution.
import boule as bl

ellipsoid = bl.WGS84
normal_gravity = ellipsoid.normal_gravity((gravity.longitude, gravity.latitude, gravity.height))
And plot it:
fig = pygmt.Figure()
fig.grdimage(
    normal_gravity,
    projection="W20c",
    cmap="viridis",
    shading="+a45+nt0.2",
)
fig.basemap(frame=["af", "WEsn"])
fig.colorbar(
    position="JCB+w10c",
    frame=["af", 'y+l"mGal"', 'x+l"normal gravity"'],
)
fig.coast(shorelines=True, resolution="c", area_thresh=1e4)
fig.show()
Now we can compute the gravity disturbance:
gravity_disturbance = gravity - normal_gravity
print(gravity_disturbance)
<xarray.DataArray (latitude: 1081, longitude: 2161)> Size: 19MB
array([[-35.81009235, -35.81009235, -35.81009235, ..., -35.81009235,
        -35.81009235, -35.81009235],
       [-34.06597894, -34.06597894, -34.06597894, ..., -34.06597894,
        -34.06597894, -34.06597894],
       [-33.33364042, -33.33364042, -33.33364042, ..., -33.43364042,
        -33.43364042, -33.33364042],
       ...,
       [ 11.66635958,  11.56635958,  11.46635958, ...,  11.76635958,
         11.66635958,  11.66635958],
       [ 18.13402106,  18.13402106,  18.13402106, ...,  18.13402106,
         18.13402106,  18.13402106],
       [ 15.18990765,  15.18990765,  15.18990765, ...,  15.18990765,
         15.18990765,  15.18990765]], shape=(1081, 2161))
Coordinates:
  * latitude   (latitude) float64 9kB -90.0 -89.83 -89.67 ... 89.67 89.83 90.0
  * longitude  (longitude) float64 17kB -180.0 -179.8 -179.7 ... 179.8 180.0
    height     (latitude, longitude) float32 9MB 1e+04 1e+04 ... 1e+04 1e+04
Attributes:
    Conventions:     CF-1.8
    title:           Gravity acceleration (EIGEN-6C4) at a constant geometric...
    crs:             WGS84
    source:          Generated from the EIGEN-6C4 model by the ICGEM Calculat...
    license:         Creative Commons Attribution 4.0 International Licence
    references:      https://doi.org/10.5880/icgem.2015.1
    icgem_metadata:  generating_institute: gfz-potsdam\ngenerating_date: 2021...
    standard_name:   latitude
And plot it:
import verde as vd

maxabs = vd.maxabs(gravity_disturbance)

fig = pygmt.Figure()
pygmt.makecpt(series=[-maxabs, maxabs], cmap="polar+h")
fig.grdimage(
    gravity_disturbance,
    projection="W20c",
    cmap=True,
    shading="+a45+nt0.2",
)
fig.basemap(frame=["af", "WEsn"])
fig.colorbar(
    position="JCB+w10c",
    frame=["af", 'y+l"mGal"', 'x+l"gravity disturbance"'],
)
fig.coast(shorelines=True, resolution="c", area_thresh=1e4)
fig.show()
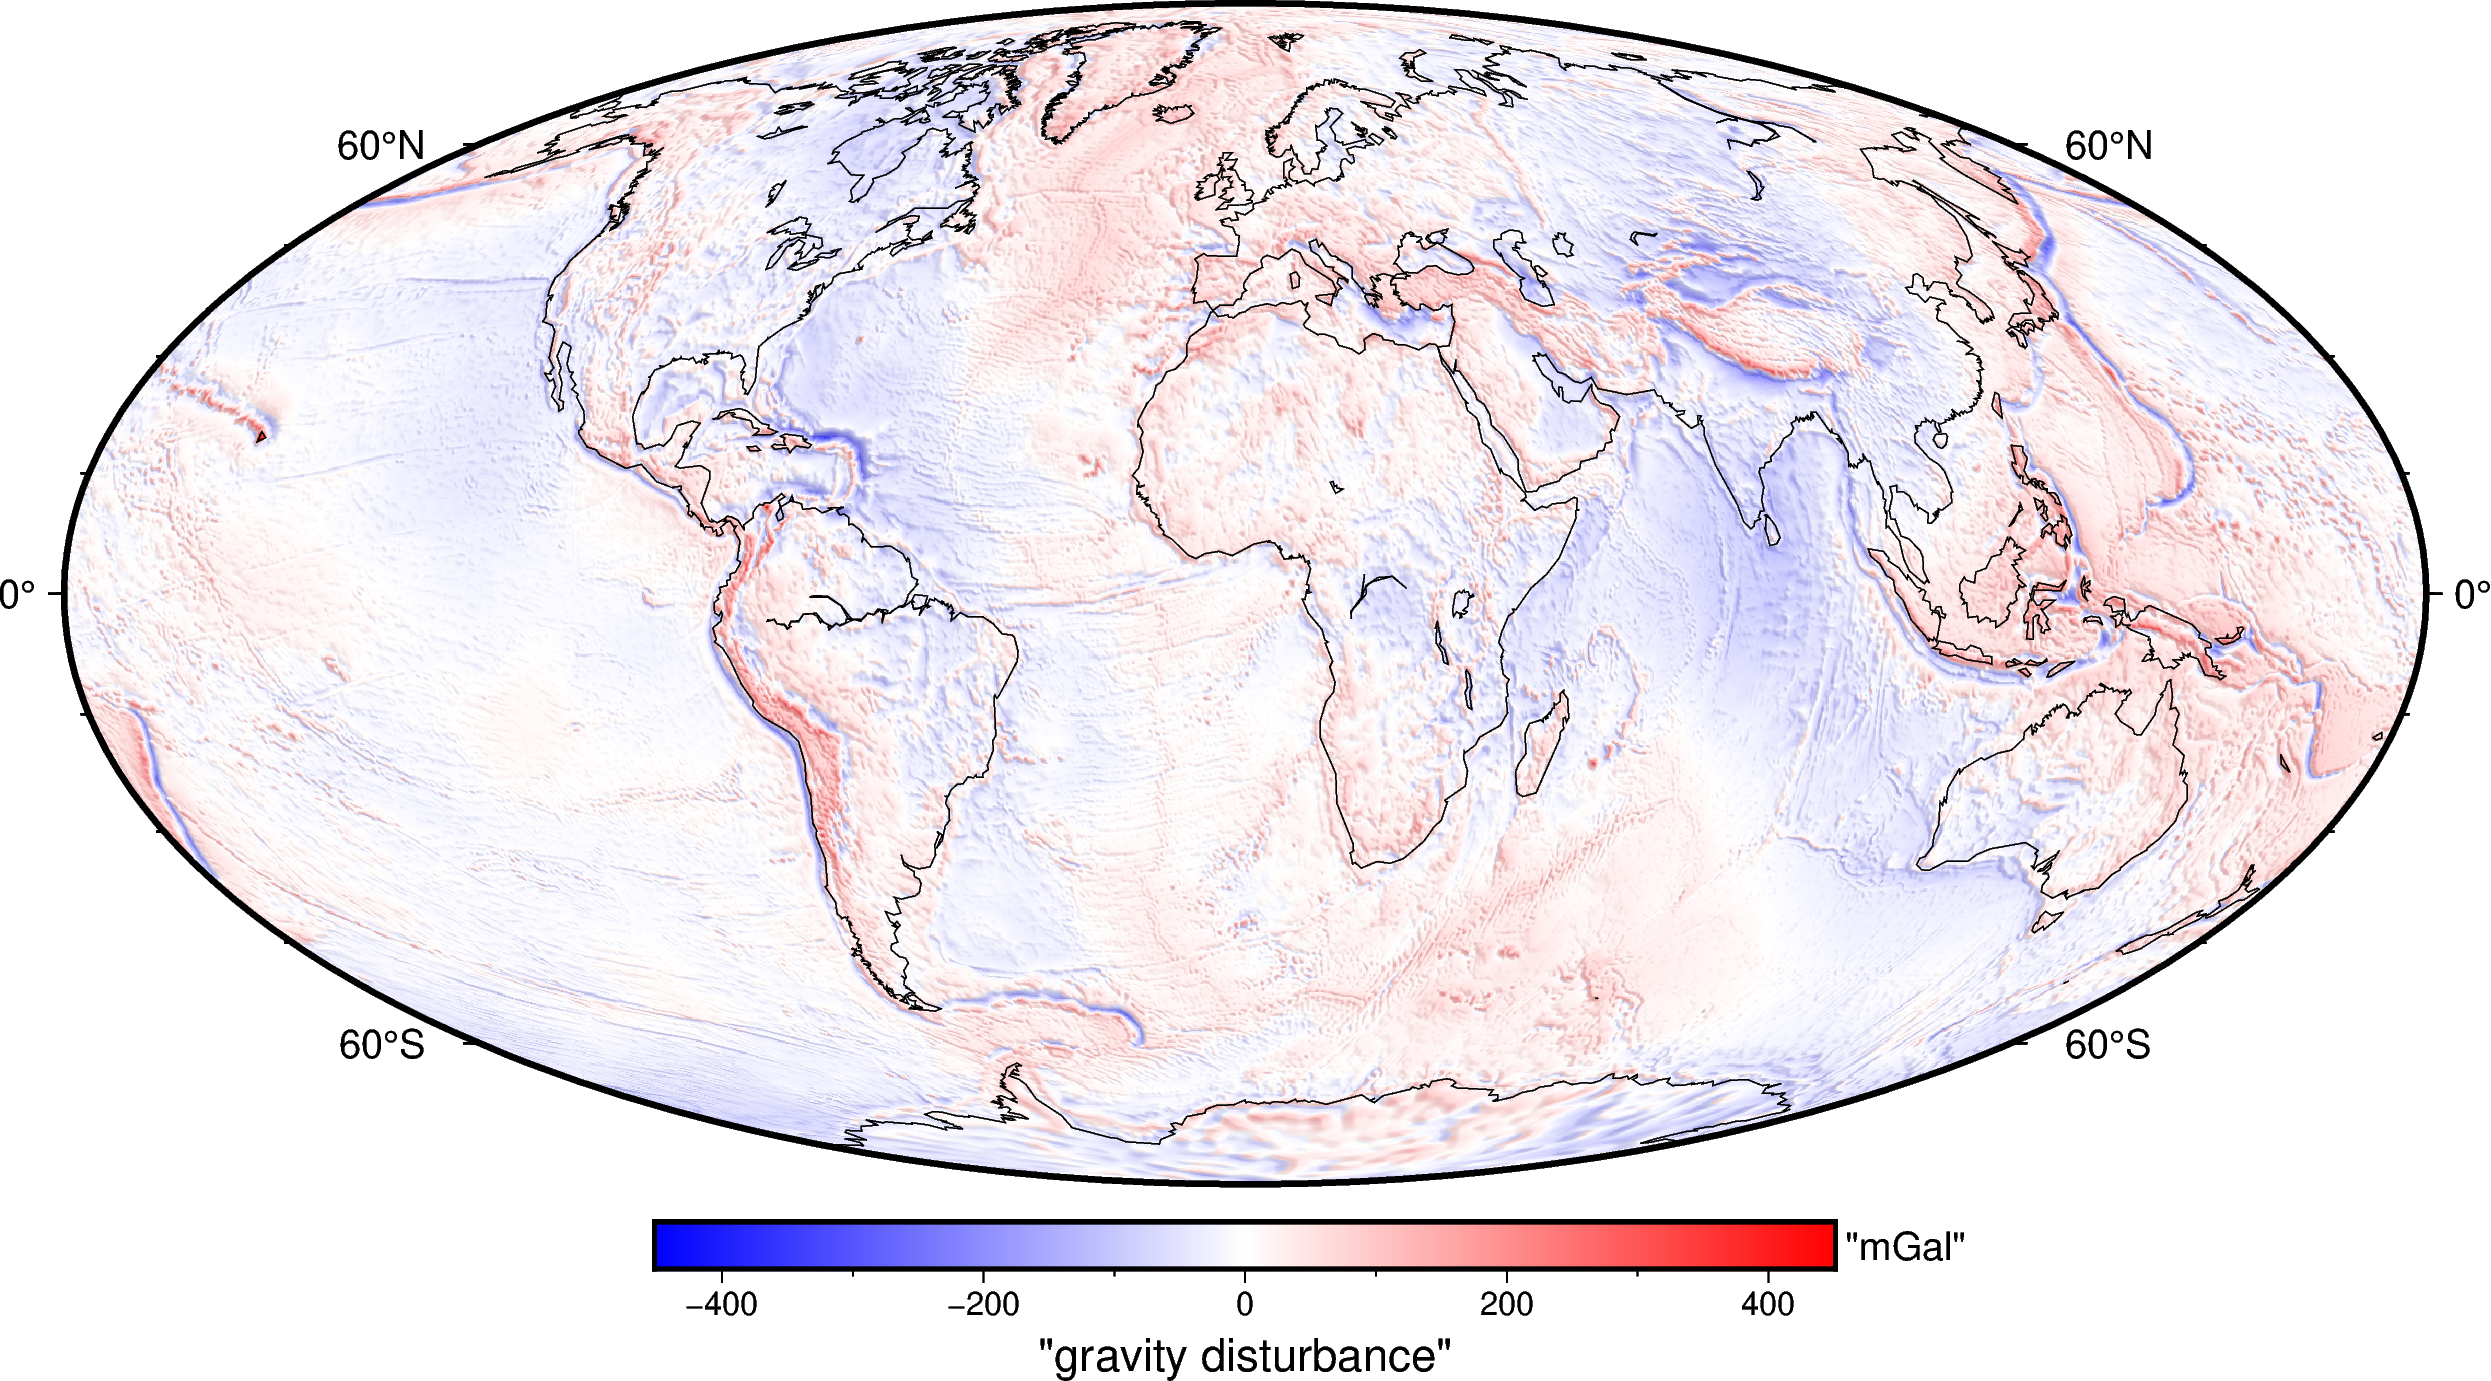
The gravity disturbances can be interpreted as the gravitational effect of every anomalous mass, i.e. that is not contained in the normal Earth.