Note
Go to the end to download the full example code
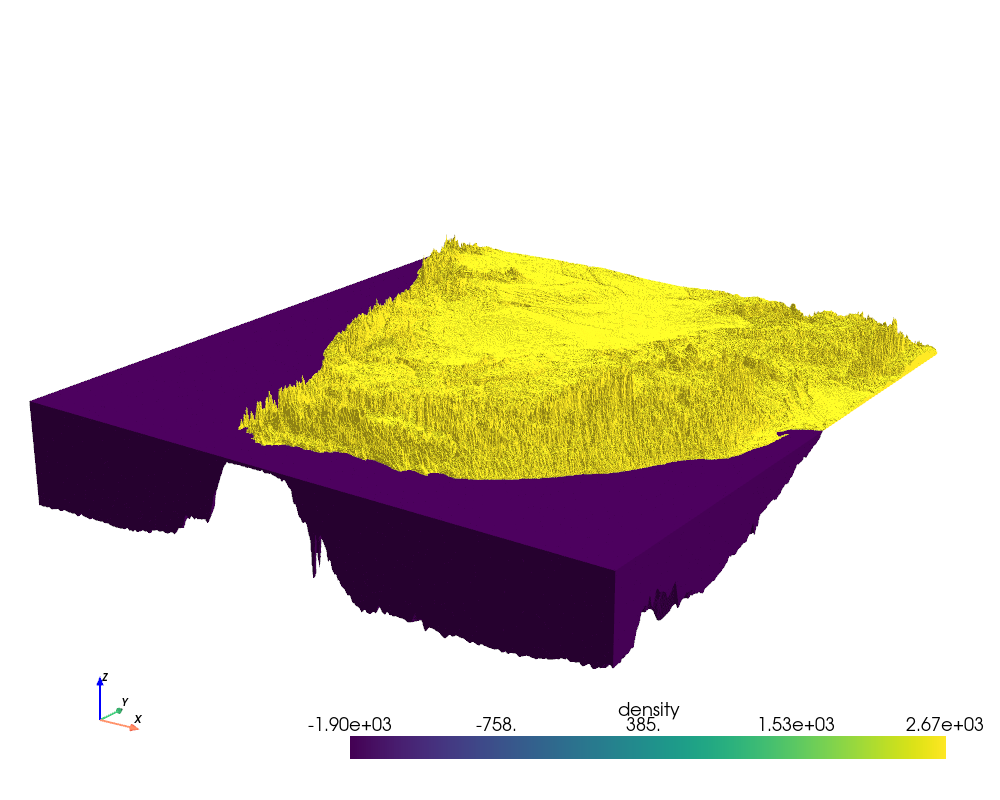
Plot a prism layer in 3D#
The harmonica.prism_layer allows to easily create a layer of prisms
whose top and bottom boundaries might drape a certain surface, like topography,
bathymetry or the Moho discontinuity. It returns a xarray.Dataset
object with the horizontal coordinates of the center of each prism, their top
and bottom boundaries and their physical properties, like their density.
Through the prism_layer accessor (see
harmonica.DatasetAccessorPrismLayer) we can call some methods for our
prism layer. For example, the
harmonica.DatasetAccessorPrismLayer.gravity method lets us compute the
gravitational fields of the layer on any set of observation points.
Another interesting method is the
harmonica.DatasetAccessorPrismLayer.to_pyvista: it converts the prism
layer into a pyvista.UnstructuredGrid that could be easily plotted
through pyvista.
In this example we will show how we can build a prism layer out of a topography
and bathymetry grid for South Africa and how we can visualize the layer as a 3D
plot using pyvista.
import ensaio
import pyproj
import pyvista as pv
import verde as vd
import xarray as xr

import harmonica as hm

# Read South Africa topography
fname = ensaio.fetch_southern_africa_topography(version=1)
south_africa_topo = xr.load_dataset(fname)

# Project the grid
projection = pyproj.Proj(proj="merc", lat_ts=south_africa_topo.latitude.values.mean())
south_africa_topo = vd.project_grid(south_africa_topo.topography, projection=projection)

# Create a 2d array with the density of the prisms Points above the geoid will
# have a density of 2670 kg/m^3 Points below the geoid will have a density
# contrast equal to the difference between the density of the ocean and the
# density of the upper crust: # 1000 kg/m^3 - 2900 kg/m^3
density = south_africa_topo.copy()  # copy topography to a new xr.DataArray
density.values[:] = 2670.0  # replace every value for the density of the topography
# Change density values of ocean points
density = density.where(south_africa_topo >= 0, 1000 - 2900)

# Create layer of prisms
prisms = hm.prism_layer(
    (south_africa_topo.easting, south_africa_topo.northing),
    surface=south_africa_topo,
    reference=0,
    properties={"density": density},
)

# Create a pyvista UnstructuredGrid from the prism layer
pv_grid = prisms.prism_layer.to_pyvista()
pv_grid
# Plot with pyvista
plotter = pv.Plotter(lighting="three_lights", window_size=(1000, 800))
plotter.add_mesh(pv_grid, scalars="density")
plotter.set_scale(zscale=75)  # exaggerate the vertical coordinate
plotter.camera_position = "xz"
plotter.camera.elevation = 20
plotter.camera.azimuth = 35
plotter.camera.zoom(1.2)

# Add a ceiling light
west, east, south, north = vd.get_region((prisms.easting, prisms.northing))
easting_center, northing_center = (east + west) / 2, (north + south) / 2
light = pv.Light(
    position=(easting_center, northing_center, 10e3),
    focal_point=(easting_center, northing_center, 0),
    intensity=0.3,
    light_type="scene light",  # the light doesn't move with the camera
    positional=False,  # the light comes from infinity
)
plotter.add_light(light)

plotter.show_axes()
plotter.show()
Total running time of the script: (2 minutes 21.889 seconds)