Note
Go to the end to download the full example code
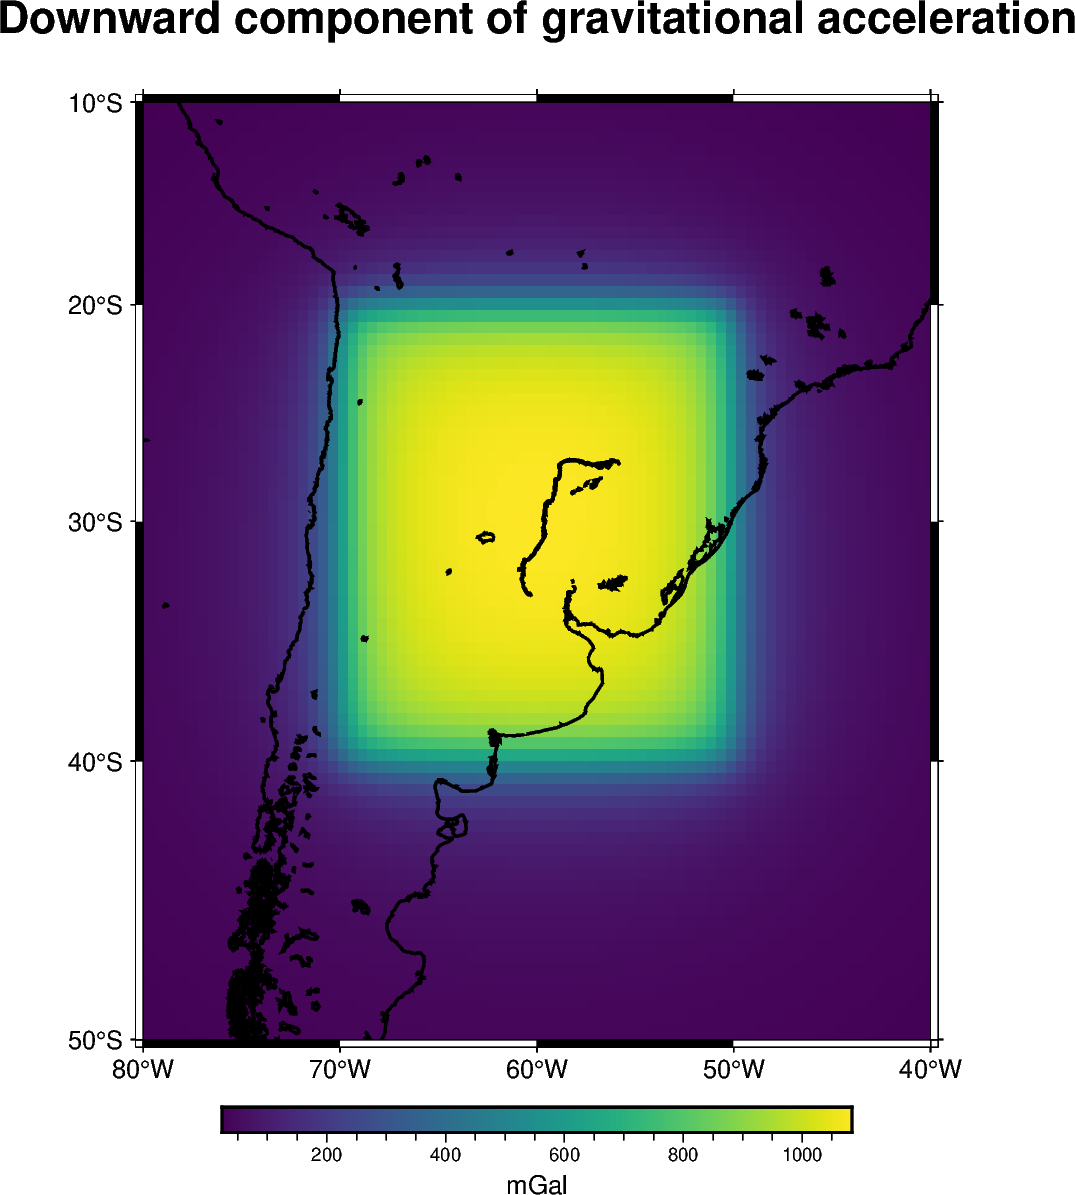
Tesseroids (spherical prisms)#
Computing the gravitational fields generated by regional or global scale
structures require to take into account the curvature of the Earth. One common
approach is to use spherical prisms also known as tesseroids. We will compute
the downward component of the gravitational acceleration generated by a single
tesseroid on a computation grid through the harmonica.tesseroid_gravity
function.
[[26.25775732 26.62128571 26.99020058 ... 26.99020058 26.62128571
  26.25775732]
 [26.82674512 27.21872948 27.61740509 ... 27.61740509 27.21872948
  26.82674512]
 [27.41565121 27.83863962 28.26987358 ... 28.26987358 27.83863962
  27.41565121]
 ...
 [24.38759784 24.84348036 25.31327033 ... 25.31327033 24.84348036
  24.38759784]
 [23.90558341 24.33513961 24.77680594 ... 24.77680594 24.33513961
  23.90558341]
 [23.43939569 23.84445919 24.26006045 ... 24.26006045 23.84445919
  23.43939569]]
import boule as bl
import pygmt
import verde as vd

import harmonica as hm

# Use the WGS84 ellipsoid to obtain the mean Earth radius which we'll use to
# reference the tesseroid
ellipsoid = bl.WGS84

# Define tesseroid with top surface at the mean Earth radius, thickness of 10km
# (bottom = top - thickness) and density of 2670kg/m^3
tesseroid = [-70, -50, -40, -20, ellipsoid.mean_radius - 10e3, ellipsoid.mean_radius]
density = 2670

# Define computation points on a regular grid at 100km above the mean Earth
# radius
coordinates = vd.grid_coordinates(
    region=[-80, -40, -50, -10],
    shape=(80, 80),
    extra_coords=100e3 + ellipsoid.mean_radius,
)

# Compute the radial component of the acceleration
gravity = hm.tesseroid_gravity(coordinates, tesseroid, density, field="g_z")
print(gravity)
grid = vd.make_xarray_grid(
    coordinates, gravity, data_names="gravity", extra_coords_names="extra"
)

# Plot the gravitational field
fig = pygmt.Figure()

title = "Downward component of gravitational acceleration"

with pygmt.config(FONT_TITLE="16p"):
    fig.grdimage(
        region=[-80, -40, -50, -10],
        projection="M-60/-30/10c",
        grid=grid.gravity,
        frame=["a", f"+t{title}"],
        cmap="viridis",
    )

fig.colorbar(cmap=True, frame=["a200f50", "x+lmGal"])

fig.coast(shorelines="1p,black")

fig.show()
Total running time of the script: (0 minutes 4.629 seconds)