harmonica.visualization.prism_to_pyvista#
- harmonica.visualization.prism_to_pyvista(prisms, properties=None)[source]#
Create a
pyvista.UnstructuredGridout of prismsBuilds a
pyvista.UnstructuredGridout of a set of prisms that could be used to plot a 3D representation throughpyvista.- Parameters:
- prisms
listor 2d-array List or 2d-array with the boundaries of the prisms. Each row contains the boundaries of each prism in the following order:
west,east,south,north,bottom,top.- properties
dictorNone(optional) Dictionary with the physical properties of the prisms. Each key should be a string and its corresponding value a 1D array. If None, no property will be added to the
pyvista.UnstructuredGrid. Default to None.
- prisms
- Returns:
- pv_grid
pyvista.UnstructuredGrid pyvista.UnstructuredGridthat represents the prisms with their properties (if any).
- pv_grid
Examples
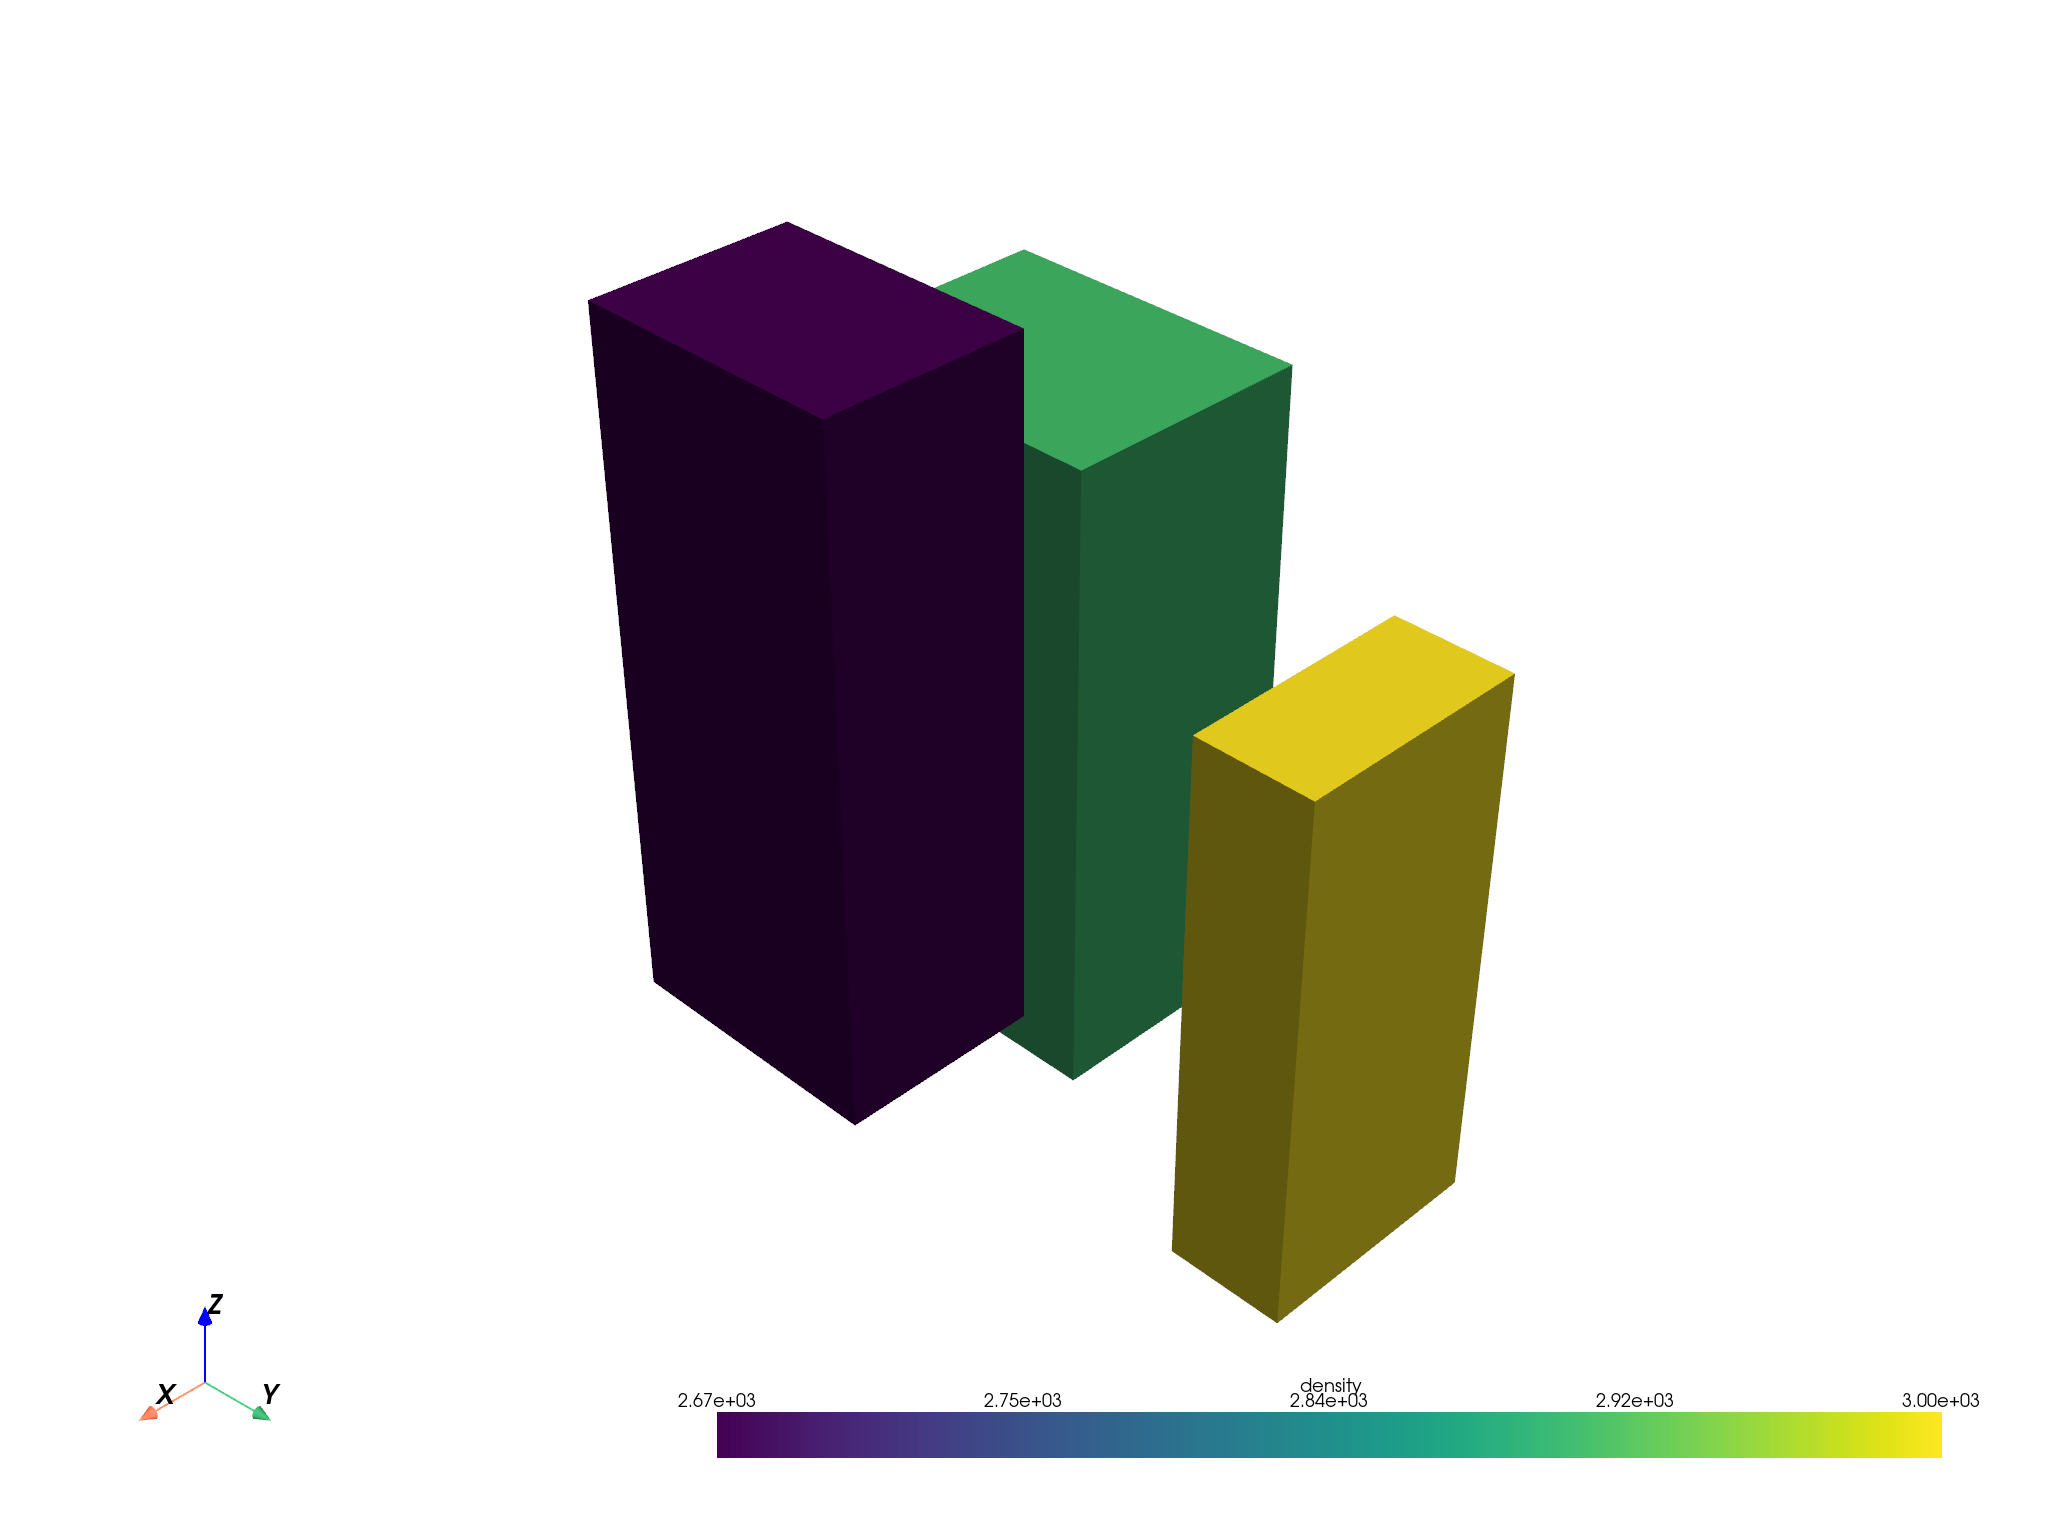
Define a set of prisms and their densities:
>>> prisms = [
...     [0, 4, 0, 5, -10, 0],
...     [0, 4, 7, 9, -12, -3],
...     [6, 9, 2, 6, -7, 3],
... ]
>>> densities = [2900, 3000, 2670]
Generate a
pyvista.UnstructuredGridout of them:>>> import harmonica as hm >>> pv_grid = hm.visualization.prism_to_pyvista( ... prisms, properties={"density": densities} ... ) >>> pv_grid
Plot it using
pyvista:>>> pv_grid.plot()