Note
Go to the end to download the full example code
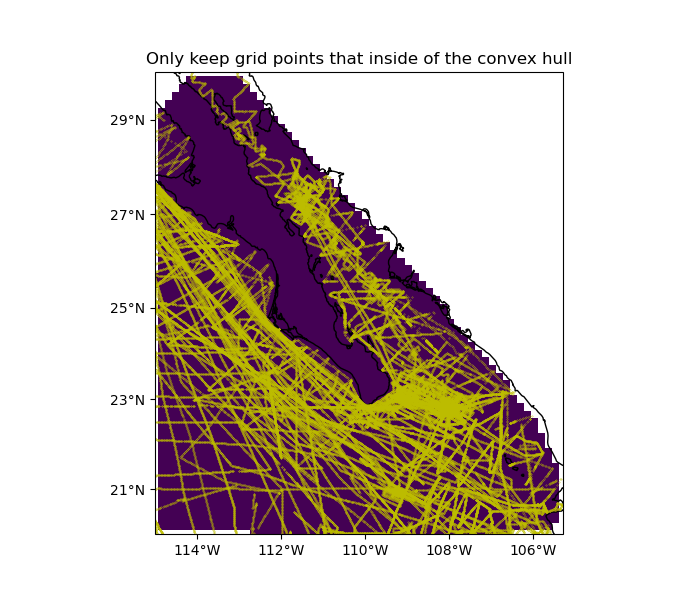
Mask grid points by convex hull#
Sometimes, data points are unevenly distributed. In such cases, we might not
want to have interpolated grid points that are too far from any data point.
Function verde.convexhull_mask allows us to set grid points that fall
outside of the convex hull of the data points to NaN or some other value.
[[False False False ... False False False]
 [False  True  True ...  True False False]
 [False  True  True ...  True  True False]
 ...
 [False False False ... False False False]
 [False False False ... False False False]
 [False False False ... False False False]]
/home/runner/work/verde/verde/doc/gallery_src/convex_hull_mask.py:56: UserWarning: All kwargs are being ignored. They are accepted to guarantee backward compatibility.
  vd.datasets.setup_baja_bathymetry_map(ax, land=None)
import cartopy.crs as ccrs
import matplotlib.pyplot as plt
import numpy as np
import pyproj

import verde as vd

# The Baja California bathymetry dataset has big gaps on land. We want to mask
# these gaps on a dummy grid that we'll generate over the region just to show
# what that looks like.
data = vd.datasets.fetch_baja_bathymetry()
region = vd.get_region((data.longitude, data.latitude))

# Generate the coordinates for a regular grid mask
spacing = 10 / 60
coordinates = vd.grid_coordinates(region, spacing=spacing)

# Generate a mask for points. The mask is True for points that are within the
# convex hull. We can provide a projection function to convert the coordinates
# before the convex hull is calculated (Mercator in this case).
mask = vd.convexhull_mask(
    data_coordinates=(data.longitude, data.latitude),
    coordinates=coordinates,
    projection=pyproj.Proj(proj="merc", lat_ts=data.latitude.mean()),
)
print(mask)

# Create a dummy grid with ones that we can mask to show the results. Turn
# points that are outside of the convex hull into NaNs so they won't show up in
# our plot.
dummy_data = np.ones_like(coordinates[0])
dummy_data[~mask] = np.nan

# Make a plot of the masked data and the data locations.
crs = ccrs.PlateCarree()
plt.figure(figsize=(7, 6))
ax = plt.axes(projection=ccrs.Mercator())
ax.set_title("Only keep grid points that inside of the convex hull")
ax.plot(data.longitude, data.latitude, ".y", markersize=0.5, transform=crs)
ax.pcolormesh(*coordinates, dummy_data, transform=crs)
vd.datasets.setup_baja_bathymetry_map(ax, land=None)
plt.show()
Total running time of the script: (0 minutes 2.930 seconds)