verde.distance_mask#
- verde.distance_mask(data_coordinates, maxdist, coordinates=None, grid=None, projection=None)[source]#
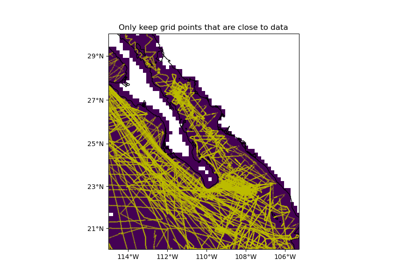
Mask grid points that are too far from the given data points.
Distances are Euclidean norms. If using geographic data, provide a projection function to convert coordinates to Cartesian before distance calculations.
Either coordinates or grid must be given:
If coordinates is not None, produces an array that is False when a point is more than maxdist from the closest data point and True otherwise.
If grid is not None, produces a mask and applies it to grid (an
xarray.Dataset).
Note
If installed, package
pykdtreewill be used instead ofscipy.spatial.cKDTreefor better performance.- Parameters:
- data_coordinates
tupleofarrays Same as coordinates but for the data points.
- maxdist
float The maximum distance that a point can be from the closest data point.
- coordinates
Noneortupleofarrays Arrays with the coordinates of each point that will be masked. Should be in the following order: (easting, northing, …). Only easting and northing will be used, all subsequent coordinates will be ignored.
- grid
Noneorxarray.Dataset 2D grid with values to be masked. Will use the first two dimensions of the grid as northing and easting coordinates, respectively. For this to work, the grid dimensions must be ordered as northing then easting. The mask will be applied to grid using the
xarray.Dataset.wheremethod.- projection
callableorNone If not None, then should be a callable object
projection(easting,
northing) -> (proj_easting, proj_northing)
that takes in easting and northing coordinate arrays and returns projected easting and northing coordinate arrays. This function will be used to project the given coordinates (or the ones extracted from the grid) before calculating distances.
- data_coordinates
- Returns:
- mask
arrayorxarray.Dataset If coordinates was given, then a boolean array with the same shape as the elements of coordinates. If grid was given, then an
xarray.Datasetwith the mask applied to it.
- mask
Examples
>>> from verde import grid_coordinates
>>> region = (0, 5, -10, -4)
>>> spacing = 1
>>> coords = grid_coordinates(region, spacing=spacing)
>>> mask = distance_mask((2.5, -7.5), maxdist=2, coordinates=coords)
>>> print(mask)
[[False False False False False False]
 [False False  True  True False False]
 [False  True  True  True  True False]
 [False  True  True  True  True False]
 [False False  True  True False False]
 [False False False False False False]
 [False False False False False False]]
>>> # Mask an xarray.Dataset directly
>>> import xarray as xr
>>> coords_dict = {"easting": coords[0][0, :], "northing": coords[1][:, 0]}
>>> data_vars = {"scalars": (["northing", "easting"], np.ones(mask.shape))}
>>> grid = xr.Dataset(data_vars, coords=coords_dict)
>>> masked = distance_mask((3.5, -7.5), maxdist=2, grid=grid)
>>> print(masked.scalars.values)
[[nan nan nan nan nan nan]
 [nan nan nan  1.  1. nan]
 [nan nan  1.  1.  1.  1.]
 [nan nan  1.  1.  1.  1.]
 [nan nan nan  1.  1. nan]
 [nan nan nan nan nan nan]
 [nan nan nan nan nan nan]]