Note
Go to the end to download the full example code
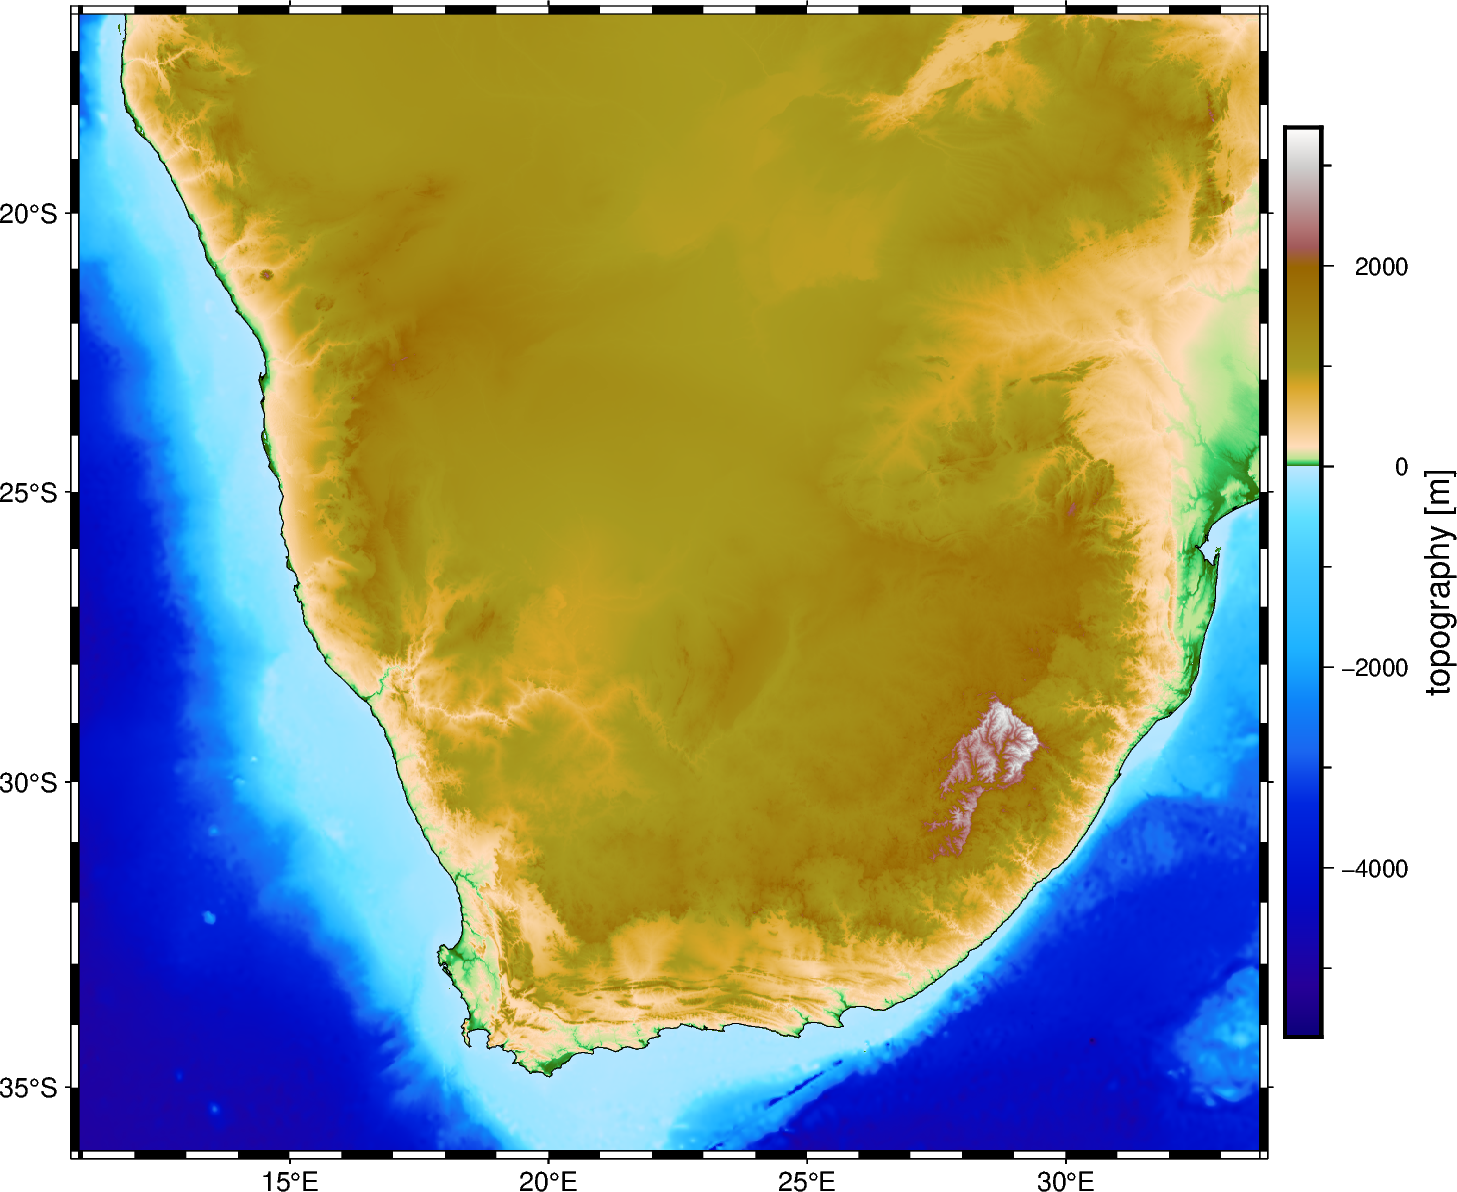
Topography and bathymetry of Southern Africa#
This dataset consists in a regular grid with topography and bathymetry over Southern Africa. It was generated by cropping the ETOPO1 global topography grid to the desired area. The topography and bathymetry heights are referenced to sea level (what can be considered as the geoid).
Original source: ETOPO1
Pre-processing: Source code for preparation of the original dataset for redistribution in Ensaio
import pygmt
import xarray as xr

import ensaio
Download and cache the data and return the path to it on disk
fname = ensaio.fetch_southern_africa_topography(version=1)
print(fname)
/home/runner/.cache/ensaio/v1/southern-africa-topography.nc
Load the netCDF file with xarray (netcdf4 is required)
Make a PyGMT map of the topography and bathymetry data
fig = pygmt.Figure()
fig.grdimage(data, cmap="etopo1", projection="M15c")
fig.colorbar(frame='af+l"topography [m]"', position="JCR")
fig.basemap(frame=True)
fig.coast(shorelines="0.1p", area_thresh=1e4)
fig.show()
Total running time of the script: (0 minutes 4.779 seconds)