Note
Go to the end to download the full example code
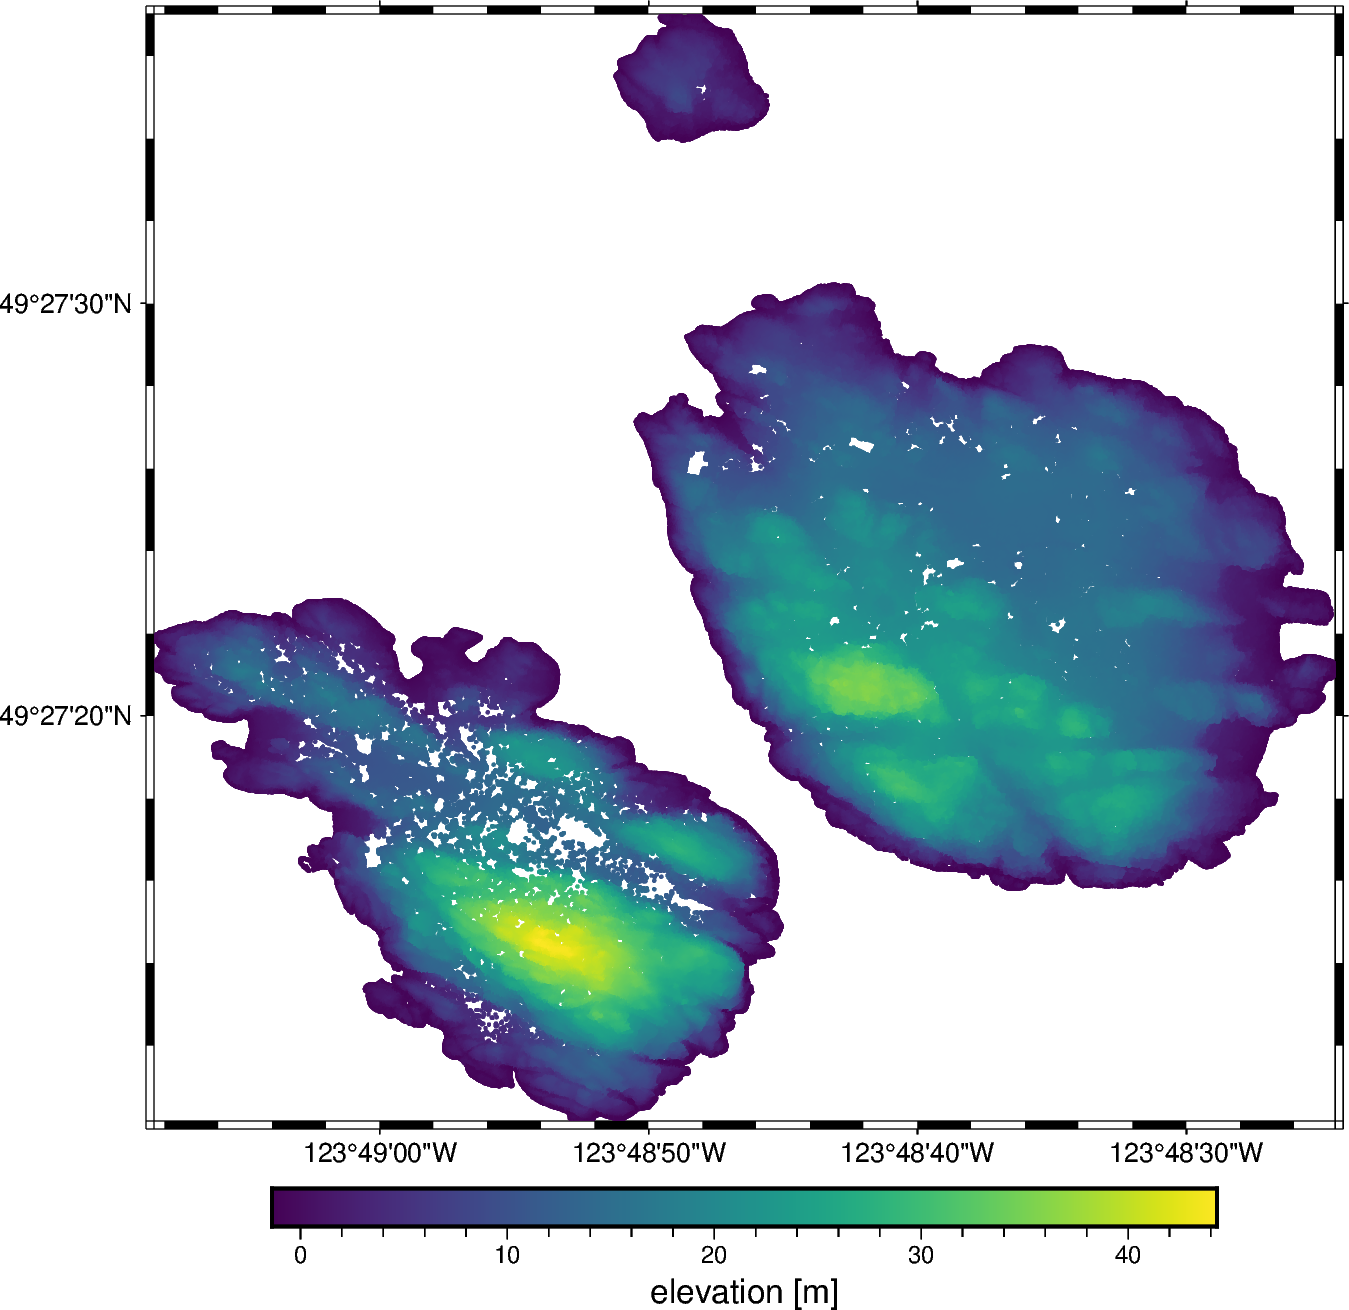
Topography of the Trail Islands in British Columbia, Canada#
This is a lidar point cloud (ground reflections only) sliced to the small Trail Islands to the North of Vancouver. The islands have some nice looking topography and their isolated nature creates problems for some interpolation methods.
Original source: LidarBC
Pre-processing: Source code for preparation of the original dataset for redistribution in Ensaio
import pandas as pd
import pygmt

import ensaio
Download and cache the data and return the path to it on disk
fname = ensaio.fetch_british_columbia_lidar(version=1)
print(fname)
/home/runner/.cache/ensaio/v1/british-columbia-lidar.csv.xz
Load the CSV formatted data with pandas
data = pd.read_csv(fname)
data
Make a PyGMT map with the data points colored by the elevation.
fig = pygmt.Figure()
fig.basemap(
    region=[
        data.longitude.min(),
        data.longitude.max(),
        data.latitude.min(),
        data.latitude.max(),
    ],
    projection="M15c",
    frame=True,
)
pygmt.makecpt(cmap="viridis", series=[data.elevation_m.min(), data.elevation_m.max()])
fig.plot(
    x=data.longitude, y=data.latitude, fill=data.elevation_m, cmap=True, style="c0.05c"
)
fig.colorbar(frame='af+l"elevation [m]"')
fig.show()
Total running time of the script: (0 minutes 13.677 seconds)