Note
Go to the end to download the full example code
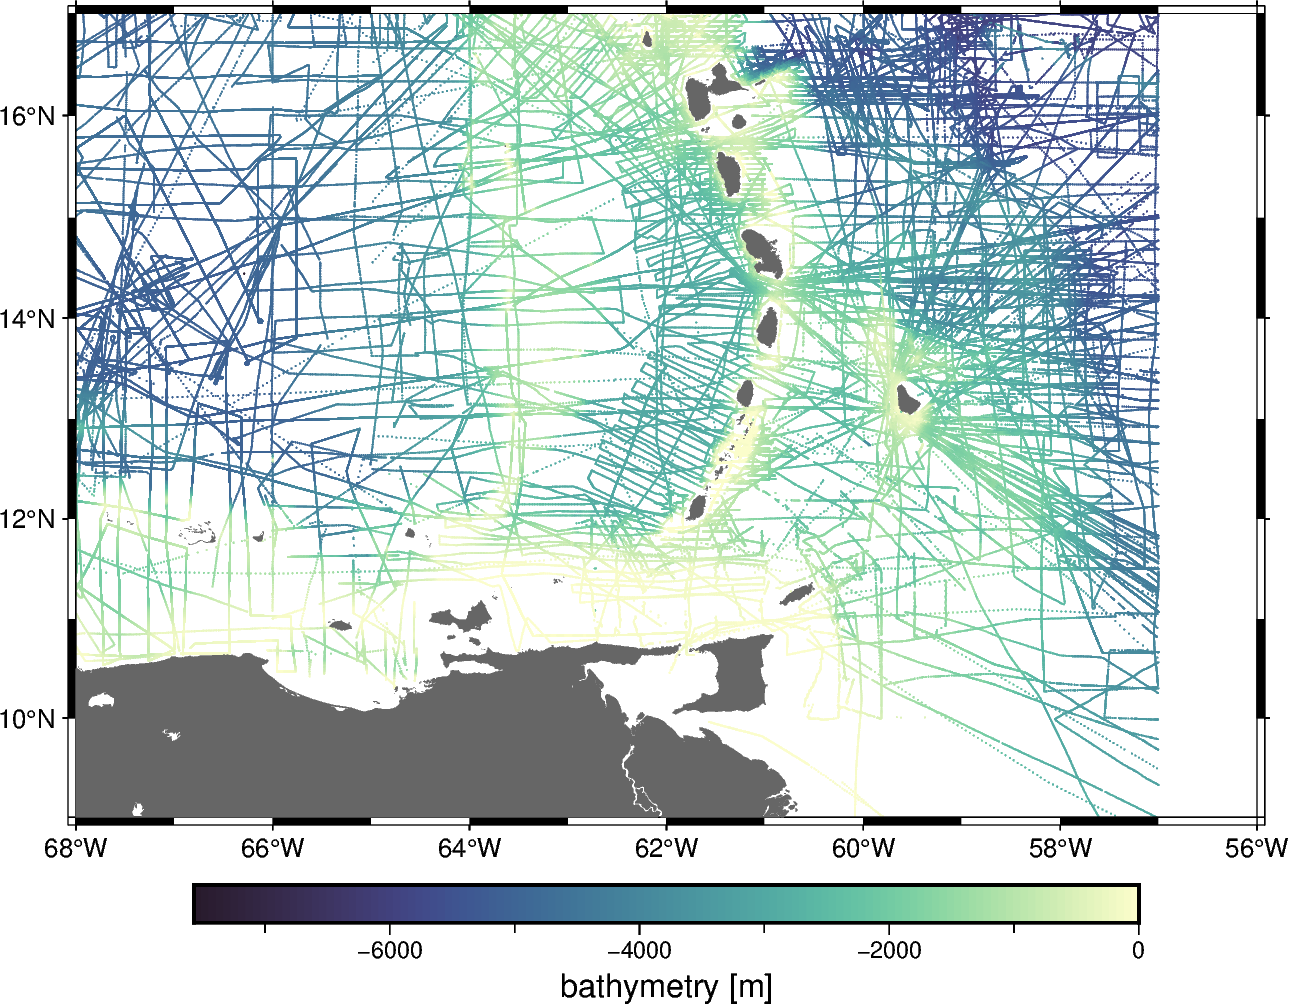
Bathymetry single-beam surveys of the Caribbean#
This dataset is a compilation of several public domain single-beam bathymetry surveys of the ocean in the Caribbean. The data display a wide range of tectonic activity and uneven distribution.
Original source: NOAA NCEI
Pre-processing: Source code for preparation of the original dataset for redistribution in Ensaio
Changes in version 2
In version 1, there were 1,938,095 data taking up a larger area. The
data were depth_m and positive downward. Version 2, cropped the
data to make it more manageable and converted the depths to bathymetric
heights (negative downward).
import pandas as pd
import pygmt

import ensaio
Download and cache the data and return the path to it on disk
fname = ensaio.fetch_caribbean_bathymetry(version=2)
print(fname)
/home/runner/.cache/ensaio/v2/caribbean-bathymetry.csv.xz
Load the CSV formatted data with pandas
data = pd.read_csv(fname)
data
Make a PyGMT map with the data points colored by the bathymetry.
fig = pygmt.Figure()
pygmt.makecpt(
    cmap="cmocean/topo+h",
    series=[data.bathymetry_m.min(), data.bathymetry_m.max()],
)
fig.plot(
    x=data.longitude,
    y=data.latitude,
    fill=data.bathymetry_m,
    cmap=True,
    style="c0.02c",
    projection="M15c",
    frame=True,
)
fig.colorbar(frame='af+l"bathymetry [m]"')
fig.coast(land="#666666")
fig.show()
Total running time of the script: (0 minutes 7.127 seconds)