Note
Go to the end to download the full example code
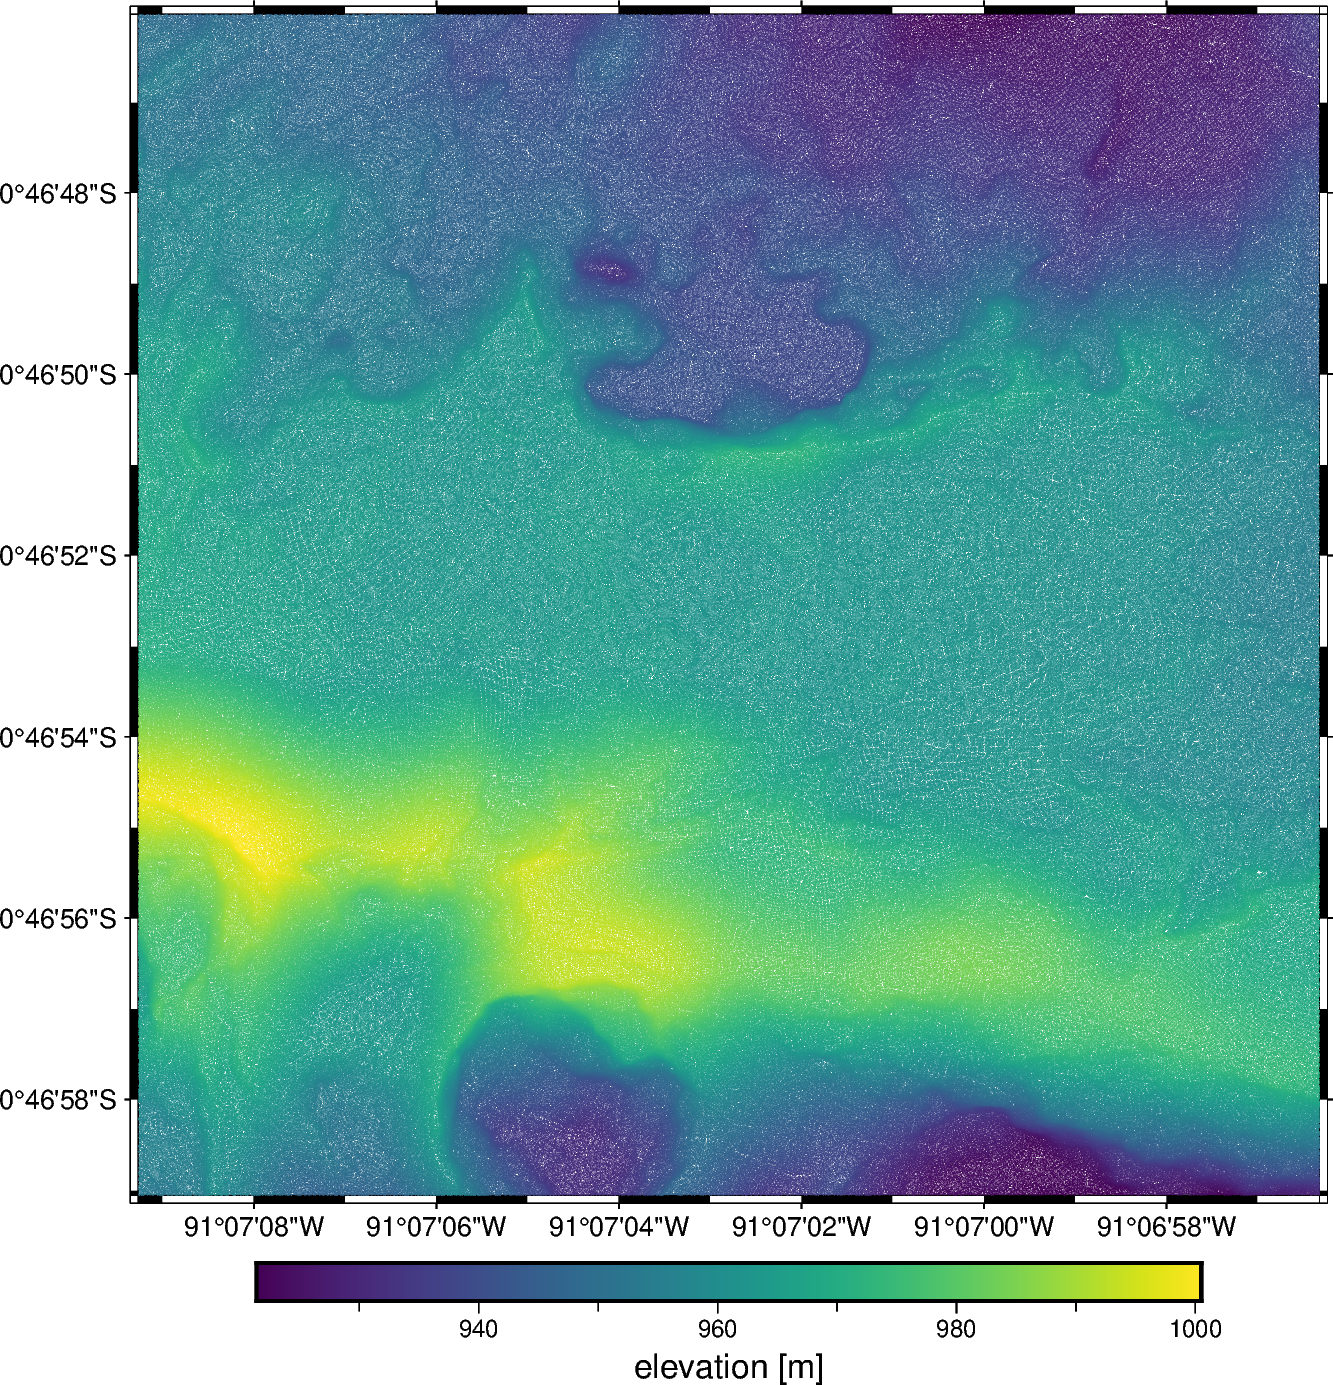
Topography of the 2018 lava flows of the Sierra Negra volcano, Ecuador#
This is a structure-from-motion point cloud of the 2018 lava flows of the Sierra Negra volcano, located on the Galápagos islands, Ecuador. The survey covers a small region at the flank of the volcano and shows different structures and terrain roughness on the lava flows.
Original source: Carr, B. (2020). Sierra Negra Volcano (TIR Flight 3): Galápagos, Ecuador, October 22 2018. Distributed by OpenTopography.
Pre-processing: Source code for preparation of the original dataset for redistribution in Ensaio
import pandas as pd
import pygmt

import ensaio
Download and cache the data and return the path to it on disk
fname = ensaio.fetch_sierra_negra_topography(version=1)
print(fname)
/home/runner/.cache/ensaio/v1/sierra-negra-topography.csv.xz
Load the CSV formatted data with pandas
data = pd.read_csv(fname)
data
Make a PyGMT map with the data points colored by the elevation.
fig = pygmt.Figure()
fig.basemap(
    region=[
        data.longitude.min(),
        data.longitude.max(),
        data.latitude.min(),
        data.latitude.max(),
    ],
    projection="M15c",
    frame=True,
)
pygmt.makecpt(cmap="viridis", series=[data.elevation_m.min(), data.elevation_m.max()])
fig.plot(
    x=data.longitude, y=data.latitude, fill=data.elevation_m, cmap=True, style="c0.01c"
)
fig.colorbar(frame='af+l"elevation [m]"')
fig.show()
Total running time of the script: (0 minutes 21.129 seconds)