Note
Go to the end to download the full example code
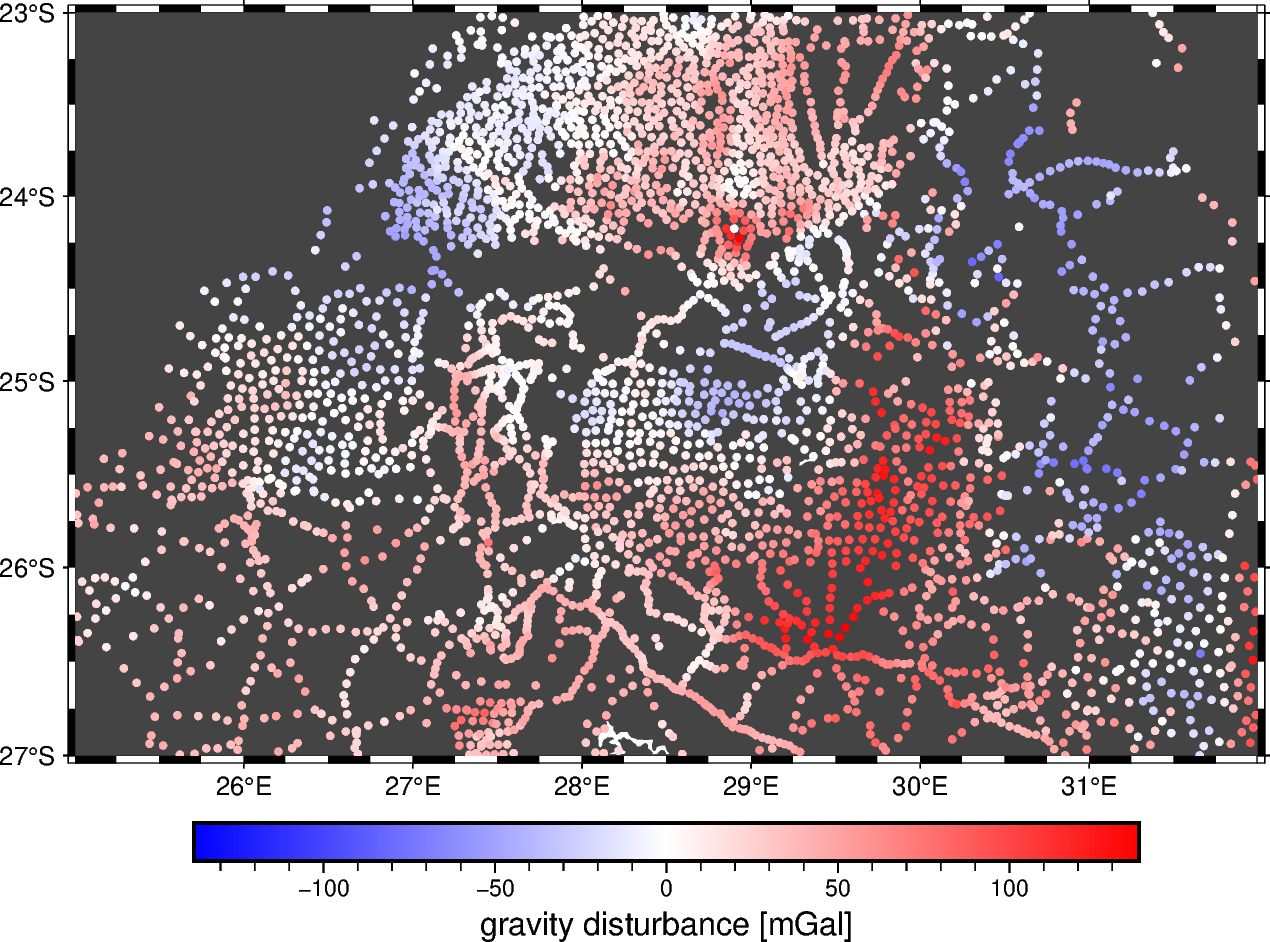
Gravity ground-based data over the Bushveld Complex, Southern Africa#
This dataset contains ground gravity observations over the area that comprises the Bushveld Igenous Complex in Southern Africa, including preprocessed gravity fields such as the gravity disturbance and the Bouguer gravity disturbance (topography-free gravity disturbance). In addition, the dataset contains the heights of the observation points referenced on the WGS84 reference ellipsoid and over the mean sea-level (what can be considered to be the geoid). This dataset was built upon a portion of the Southern Africa gravity compilation available through NOAA NCEI.
Original source:
Pre-processing: Source code for preparation of the original dataset for redistribution in Ensaio
import numpy as np
import pandas as pd
import pygmt

import ensaio
Download and cache the data and return the path to it on disk
fname = ensaio.fetch_bushveld_gravity(version=1)
print(fname)
/home/runner/.cache/ensaio/v1/bushveld-gravity.csv.xz
Load the CSV formatted data with pandas
data = pd.read_csv(fname)
data
Make a PyGMT map with the data points colored by the gravity data.
fig = pygmt.Figure()
fig.basemap(
    region=[
        data.longitude.min(),
        data.longitude.max(),
        data.latitude.min(),
        data.latitude.max(),
    ],
    projection="M15c",
    frame=True,
)
fig.coast(land="#444444")
scale = np.max(np.abs(data.gravity_disturbance_mgal))
pygmt.makecpt(
    cmap="polar",
    series=[-scale, scale],
)
fig.plot(
    x=data.longitude,
    y=data.latitude,
    fill=data.gravity_disturbance_mgal,
    cmap=True,
    style="c0.1c",
)
fig.colorbar(frame='af+l"gravity disturbance [mGal]"')
fig.show()
Total running time of the script: (0 minutes 2.938 seconds)