Note
Go to the end to download the full example code
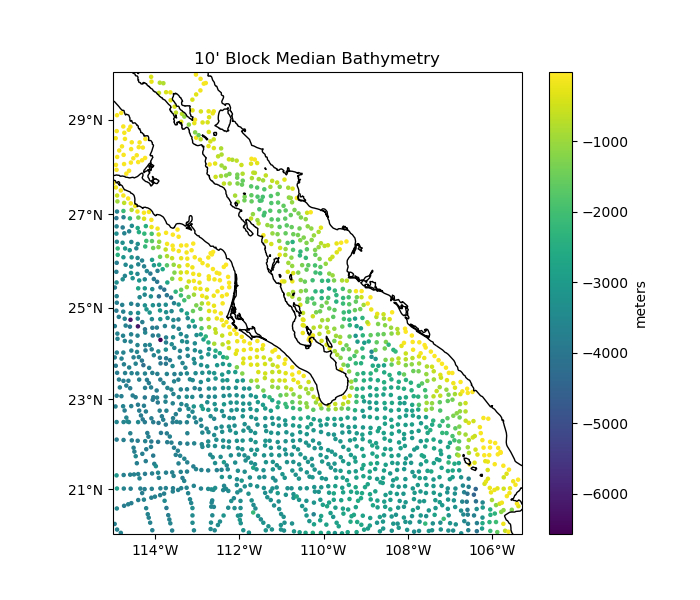
Blocked reduction operations#
When gridding data that has been highly oversampled in a direction (shipborne
and airborne data, for example), it is important to decimate the data before
interpolation to avoid aliasing. Class verde.BlockReduce decimates
data by applying a reduction operation (mean, median, mode, max, etc) to the
data in blocks. For non-smooth data, like bathymetry, a blocked median filter
is a good choice.
/usr/share/miniconda/envs/test/lib/python3.12/site-packages/verde/blockreduce.py:179: FutureWarning: The provided callable <function median at 0x7fe6dfec7380> is currently using DataFrameGroupBy.median. In a future version of pandas, the provided callable will be used directly. To keep current behavior pass the string "median" instead.
  blocked = pd.DataFrame(columns).groupby("block").aggregate(reduction)
/usr/share/miniconda/envs/test/lib/python3.12/site-packages/verde/blockreduce.py:236: FutureWarning: The provided callable <function median at 0x7fe6dfec7380> is currently using DataFrameGroupBy.median. In a future version of pandas, the provided callable will be used directly. To keep current behavior pass the string "median" instead.
  grouped = table.groupby("block").aggregate(self.reduction)
Original data size: 82970
Decimated data size: 1801
import cartopy.crs as ccrs
import matplotlib.pyplot as plt
import numpy as np

import verde as vd

# We'll test this on the Baja California shipborne bathymetry data
data = vd.datasets.fetch_baja_bathymetry()

# Decimate the data using a blocked median with 10 arc-minute blocks
reducer = vd.BlockReduce(reduction=np.median, spacing=10 / 60)
coordinates, bathymetry = reducer.filter(
    (data.longitude, data.latitude), data.bathymetry_m
)
lon, lat = coordinates

print("Original data size:", data.bathymetry_m.size)
print("Decimated data size:", bathymetry.size)

# Make a plot of the decimated data using Cartopy
plt.figure(figsize=(7, 6))
ax = plt.axes(projection=ccrs.Mercator())
ax.set_title("10' Block Median Bathymetry")
# Plot the bathymetry as colored circles.
plt.scatter(lon, lat, c=bathymetry, s=5, transform=ccrs.PlateCarree())
plt.colorbar().set_label("meters")
# Use a utility function to setup the tick labels and land feature
vd.datasets.setup_baja_bathymetry_map(ax)
plt.show()
Total running time of the script: (0 minutes 0.173 seconds)