Note
Click here to download the full example code
Blocked reduction operations
When gridding data that has been highly oversampled in a direction (shipborne
and airborne data, for example), it is important to decimate the data before
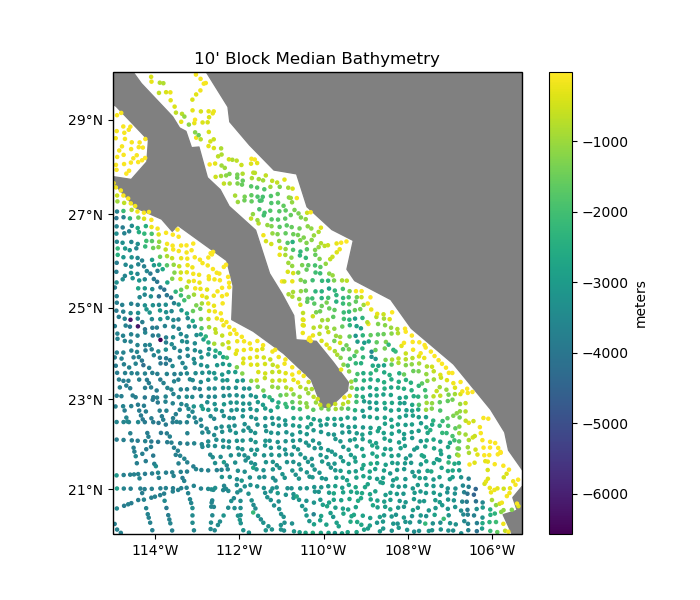
interpolation to avoid aliasing. Class verde.BlockReduce decimates
data by applying a reduction operation (mean, median, mode, max, etc) to the
data in blocks. For non-smooth data, like bathymetry, a blocked median filter
is a good choice.
Out:
Original data size: 82970
Decimated data size: 1801
/home/travis/miniconda/envs/testing/lib/python3.6/site-packages/cartopy/mpl/geoaxes.py:782: MatplotlibDeprecationWarning: Passing the minor parameter of set_xticks() positionally is deprecated since Matplotlib 3.2; the parameter will become keyword-only two minor releases later.
  return super(GeoAxes, self).set_xticks(xticks, minor)
/home/travis/miniconda/envs/testing/lib/python3.6/site-packages/cartopy/mpl/geoaxes.py:829: MatplotlibDeprecationWarning: Passing the minor parameter of set_yticks() positionally is deprecated since Matplotlib 3.2; the parameter will become keyword-only two minor releases later.
  return super(GeoAxes, self).set_yticks(yticks, minor)
/home/travis/build/fatiando/verde/examples/blockreduce.py:39: UserWarning: Tight layout not applied. The left and right margins cannot be made large enough to accommodate all axes decorations.
  plt.tight_layout()
import matplotlib.pyplot as plt
import cartopy.crs as ccrs
import numpy as np
import verde as vd

# We'll test this on the Baja California shipborne bathymetry data
data = vd.datasets.fetch_baja_bathymetry()

# Decimate the data using a blocked median with 10 arc-minute blocks
reducer = vd.BlockReduce(reduction=np.median, spacing=10 / 60)
coordinates, bathymetry = reducer.filter(
    (data.longitude, data.latitude), data.bathymetry_m
)
lon, lat = coordinates

print("Original data size:", data.bathymetry_m.size)
print("Decimated data size:", bathymetry.size)

# Make a plot of the decimated data using Cartopy
plt.figure(figsize=(7, 6))
ax = plt.axes(projection=ccrs.Mercator())
ax.set_title("10' Block Median Bathymetry")
# Plot the bathymetry as colored circles.
plt.scatter(lon, lat, c=bathymetry, s=5, transform=ccrs.PlateCarree())
plt.colorbar().set_label("meters")
# Use a utility function to setup the tick labels and land feature
vd.datasets.setup_baja_bathymetry_map(ax)
plt.tight_layout()
plt.show()
Total running time of the script: ( 0 minutes 0.303 seconds)