Note
Click here to download the full example code
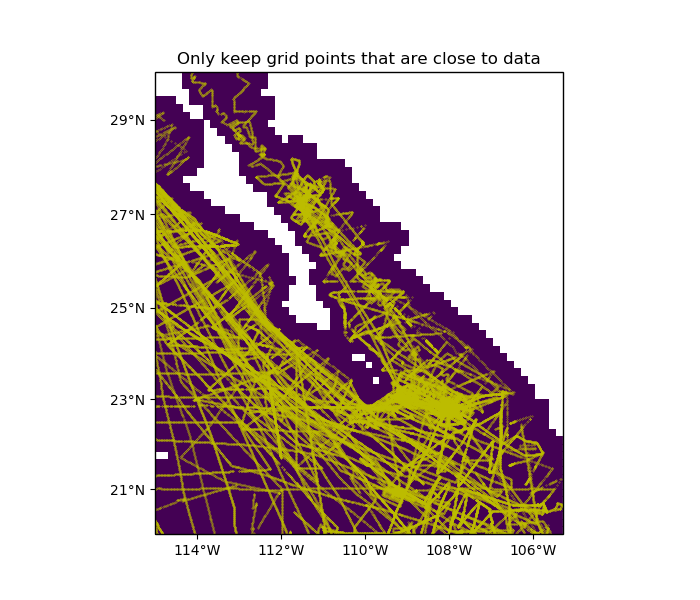
Mask grid points by distance
Sometimes, data points are unevenly distributed. In such cases, we might not want to
have interpolated grid points that are too far from any data point. Function
verde.distance_mask allows us to set such points to NaN or some other value.
Out:
[[ True  True  True ...  True  True  True]
 [ True  True  True ...  True  True  True]
 [ True  True  True ...  True  True  True]
 ...
 [False False False ... False False False]
 [False False False ... False False False]
 [False False False ... False False False]]
/home/travis/build/fatiando/verde/examples/distance_mask.py:51: UserWarning: Tight layout not applied. The left and right margins cannot be made large enough to accommodate all axes decorations.
  plt.tight_layout()
import matplotlib.pyplot as plt
import cartopy.crs as ccrs
import pyproj
import numpy as np
import verde as vd

# The Baja California bathymetry dataset has big gaps on land. We want to mask these
# gaps on a dummy grid that we'll generate over the region.
data = vd.datasets.fetch_baja_bathymetry()
region = vd.get_region((data.longitude, data.latitude))

# Generate the coordinates for a regular grid mask
spacing = 10 / 60
coordinates = vd.grid_coordinates(region, spacing=spacing)

# Generate a mask for points that are more than 2 grid spacings away from any data
# point. The mask is True for points that are within the maximum distance. Distance
# calculations in the mask are Cartesian only. We can provide a projection function to
# convert the coordinates before distances are calculated (Mercator in this case). In
# this case, the maximum distance is also Cartesian and must be converted from degrees
# to meters.
mask = vd.distance_mask(
    (data.longitude, data.latitude),
    maxdist=spacing * 2 * 111e3,
    coordinates=coordinates,
    projection=pyproj.Proj(proj="merc", lat_ts=data.latitude.mean()),
)
print(mask)

# Create a dummy grid with ones that we can mask to show the results.
# Turn points that are too far into NaNs so they won't show up in our plot.
dummy_data = np.ones_like(coordinates[0])
dummy_data[~mask] = np.nan

# Make a plot of the masked data and the data locations.
crs = ccrs.PlateCarree()
plt.figure(figsize=(7, 6))
ax = plt.axes(projection=ccrs.Mercator())
ax.set_title("Only keep grid points that are close to data")
ax.plot(data.longitude, data.latitude, ".y", markersize=0.5, transform=crs)
ax.pcolormesh(*coordinates, dummy_data, transform=crs)
vd.datasets.setup_baja_bathymetry_map(ax, land=None)
plt.tight_layout()
plt.show()
Total running time of the script: ( 0 minutes 0.706 seconds)