8. Calculate the median distance between points#
With irregularly sampled data, it can be useful to get some statistics about
the distances between points. This can be used to determine grid spacing, point
density calculations, and other useful things.
Bordado offers function bordado.neighbor_distance_statistics to do these
calculations.
Let’s use it on a real dataset to calculate the median distance between
neighboring points.
import ensaio
import pygmt
import pyproj
import numpy as np
import pandas as pd
import matplotlib.pyplot as plt
import bordado as bd
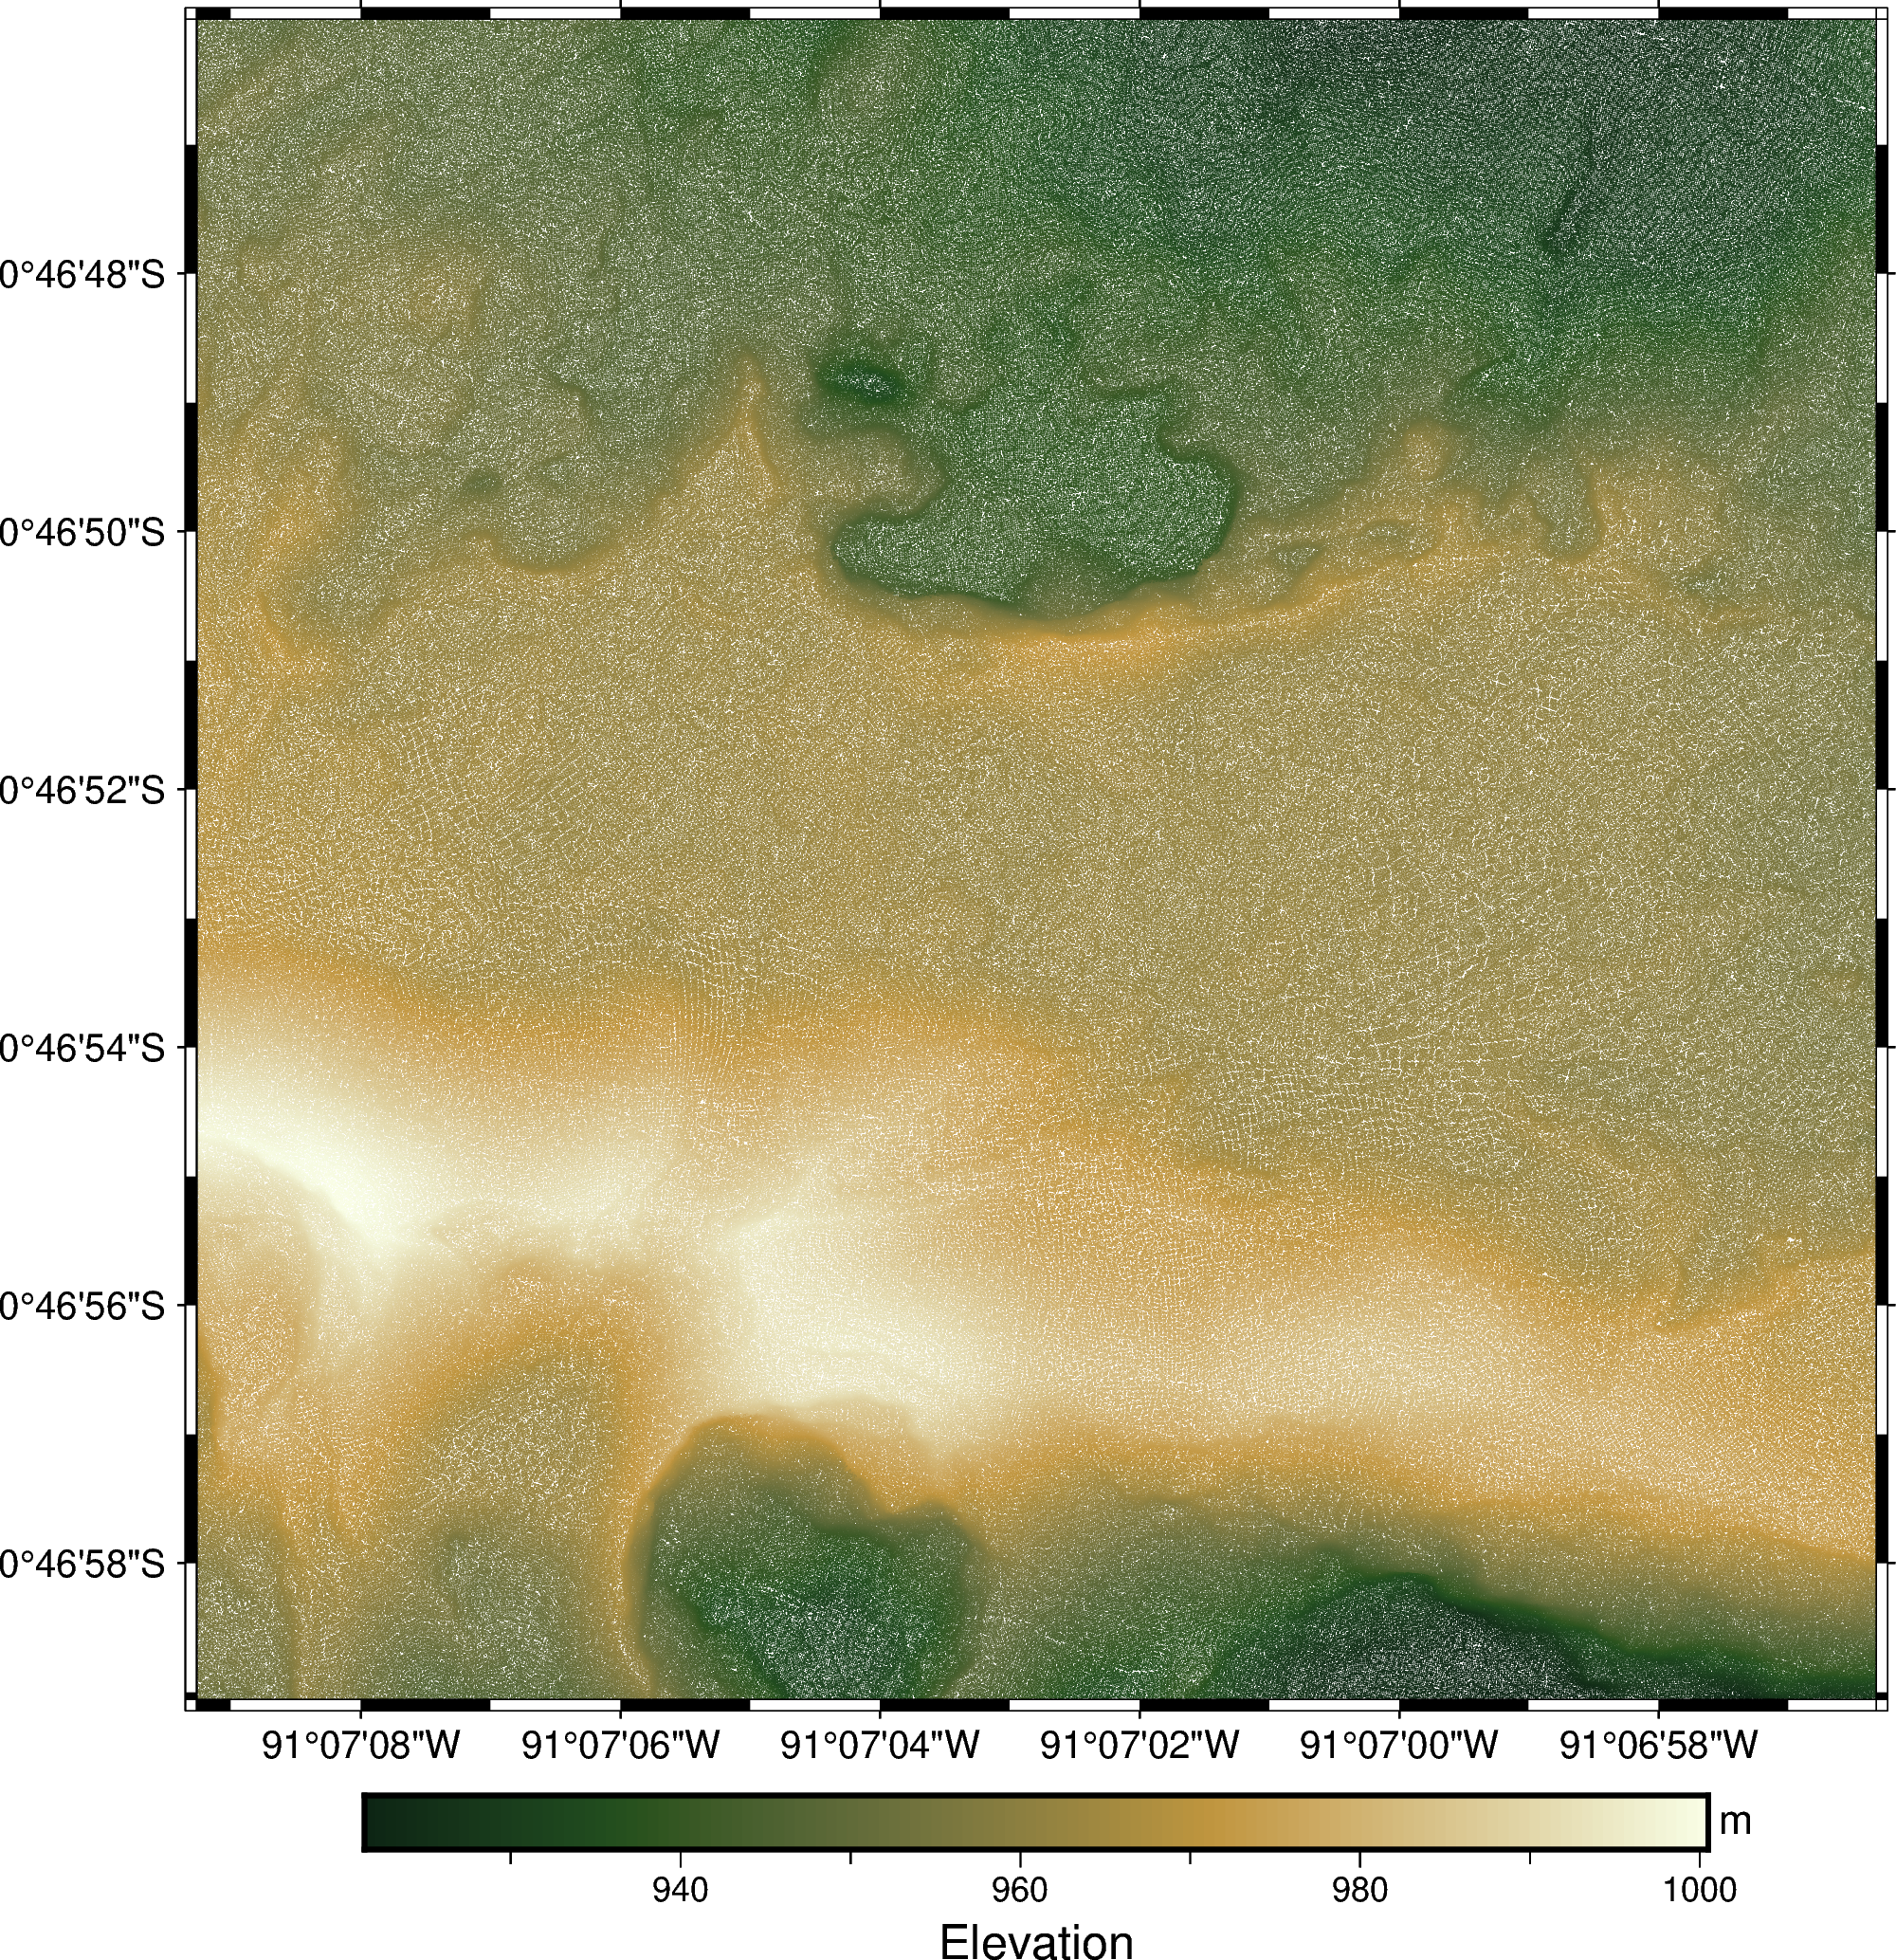
We’ll use ensaio.fetch_sierra_negra_topography to download a topography
dataset of the Sierra Negra volcano on the Galápagos. We’ll then load the data
into memory using pandas.read_csv:
fname = ensaio.fetch_sierra_negra_topography(version=1)
data = pd.read_csv(fname)
data
| longitude | latitude | elevation_m | |
|---|---|---|---|
| 0 | -91.115651 | -0.783062 | 930.1 |
| 1 | -91.115658 | -0.783056 | 930.7 |
| 2 | -91.115649 | -0.783060 | 930.3 |
| 3 | -91.115656 | -0.783063 | 929.7 |
| 4 | -91.115655 | -0.783068 | 929.2 |
| ... | ... | ... | ... |
| 1731379 | -91.118421 | -0.781943 | 990.7 |
| 1731380 | -91.118303 | -0.781933 | 990.2 |
| 1731381 | -91.118357 | -0.781971 | 992.4 |
| 1731382 | -91.118354 | -0.781940 | 991.2 |
| 1731383 | -91.118374 | -0.781945 | 991.4 |
1731384 rows × 3 columns
Let’s plot the data with pygmt to see what we’ve got:
region = bd.get_region((data.longitude, data.latitude))

fig = pygmt.Figure()
pygmt.makecpt(
    cmap="cmocean/topo+h",
    series=[data.elevation_m.min(), data.elevation_m.max()],
)
fig.plot(
    x=data.longitude,
    y=data.latitude,
    fill=data.elevation_m,
    cmap=True,
    style="c0.01c",
    projection="M15c",
    region=region,
    frame=True,
)
fig.colorbar(frame=["af+lElevation", "y+lm"])
fig.show()
The distance calculations will be Cartesian by default so we must first project the geographic coordinates using pyproj:
projection = pyproj.Proj(proj="merc", lat_ts=data.latitude.mean())
coordinates = projection(data.longitude, data.latitude)
Function neighbor_distance_statistics will calculate the
distances to the k nearest neighbors of all points and then run a statistic
(mean, median, standard deviation, etc) on these k distances.
For example, we can calculate the median distance to each points 3 nearest neighbors:
distances = bd.neighbor_distance_statistics(coordinates, "median", k=3)
print(distances)
[0.30819426 0.30599651 0.19432608 ... 0.20446417 0.27812946 0.26428307]
It can be helpful to plot a histogram of these distances to see the degree of uniformity of our dataset:
plt.figure(figsize=(8, 5))
plt.hist(distances, bins=50)
plt.xlabel("Median distance to 3 nearest neighbors (m)")
plt.ylabel("Number of occurrences")
plt.show()
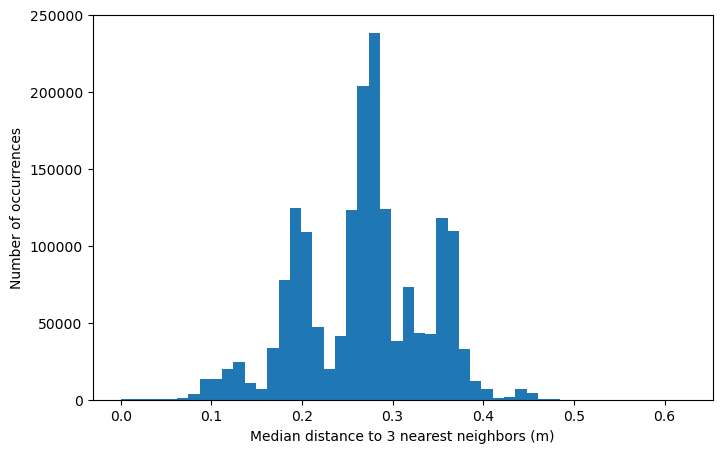
The distribution is not normal and seems to have some peaks. Nonetheless, the median of these distances can be a good summary of how close the points are:
median_distance = np.median(distances)
print(f"Median distance between points: {median_distance:.2f} m")
Median distance between points: 0.27 m
This measure can be useful for determining a grid size for interpolation, for example.