3. Select points that fall inside a region#
When we have irregularly sampled data, it can be tedious to select the
points that fall inside a given region (bounding box). It can be done with
numpy or pandas boolean indexing, of course. But Bordado offers
bordado.inside to make this easier and generalizable to n-dimensions.
Let’s see how it works on a real dataset!
import ensaio
import pygmt
import pandas as pd
import bordado as bd
We’ll use ensaio.fetch_caribbean_bathymetry to fetch some bathymetry
data from the Caribbean. The dataset is a CSV file, which can be loaded with
pandas.read_csv:
fname = ensaio.fetch_caribbean_bathymetry(version=2)
data = pd.read_csv(fname)
data
| survey_id | latitude | longitude | bathymetry_m | |
|---|---|---|---|---|
| 0 | 86005311 | 16.09652 | -61.52117 | -187 |
| 1 | 86005311 | 16.09415 | -61.52104 | -177 |
| 2 | 86005311 | 16.09177 | -61.52091 | -185 |
| 3 | 86005311 | 16.08940 | -61.52078 | -188 |
| 4 | 86005311 | 16.08703 | -61.52066 | -192 |
| ... | ... | ... | ... | ... |
| 294316 | JR336 | 15.28529 | -57.01258 | -5276 |
| 294317 | JR336 | 15.28705 | -57.00994 | -5277 |
| 294318 | JR336 | 15.28883 | -57.00732 | -5278 |
| 294319 | JR336 | 15.29057 | -57.00467 | -5277 |
| 294320 | JR336 | 15.29234 | -57.00203 | -5276 |
294321 rows × 4 columns
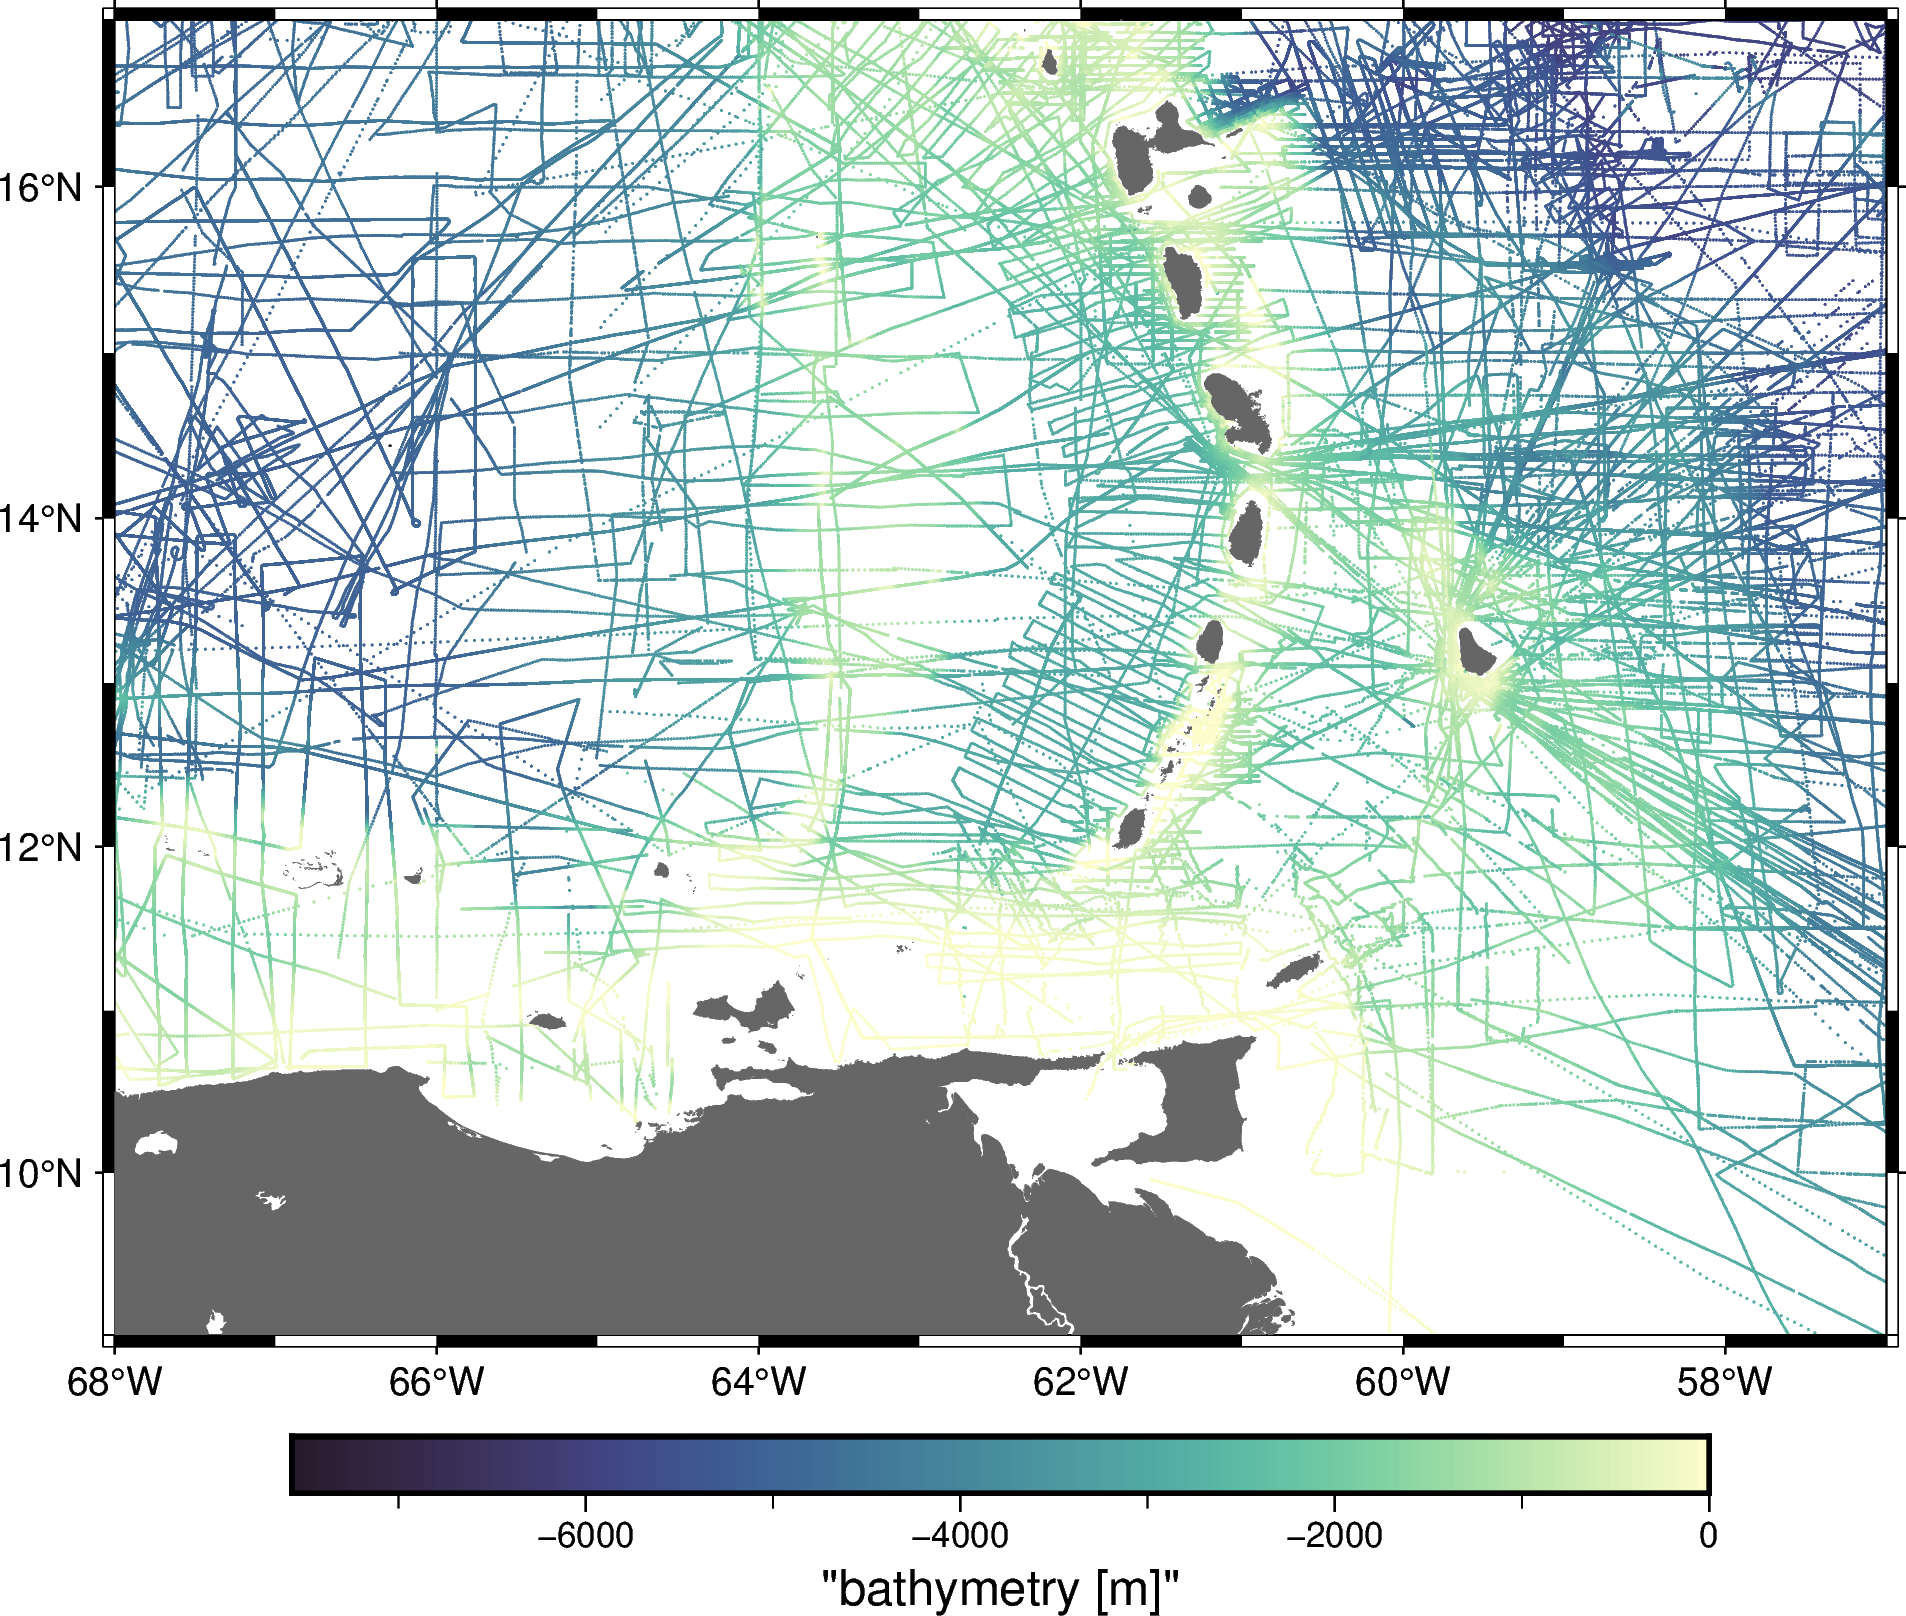
Let’s plot the data with pygmt to see what we’ve got:
region = bd.get_region((data.longitude, data.latitude))

fig = pygmt.Figure()
pygmt.makecpt(
    cmap="cmocean/topo+h",
    series=[data.bathymetry_m.min(), data.bathymetry_m.max()],
)
fig.plot(
    x=data.longitude,
    y=data.latitude,
    fill=data.bathymetry_m,
    cmap=True,
    style="c0.02c",
    projection="M15c",
    region=region,
    frame=True,
)
fig.colorbar(frame=["af+lBathymetry", "y+lm"])
fig.coast(land="#666666")
fig.show()
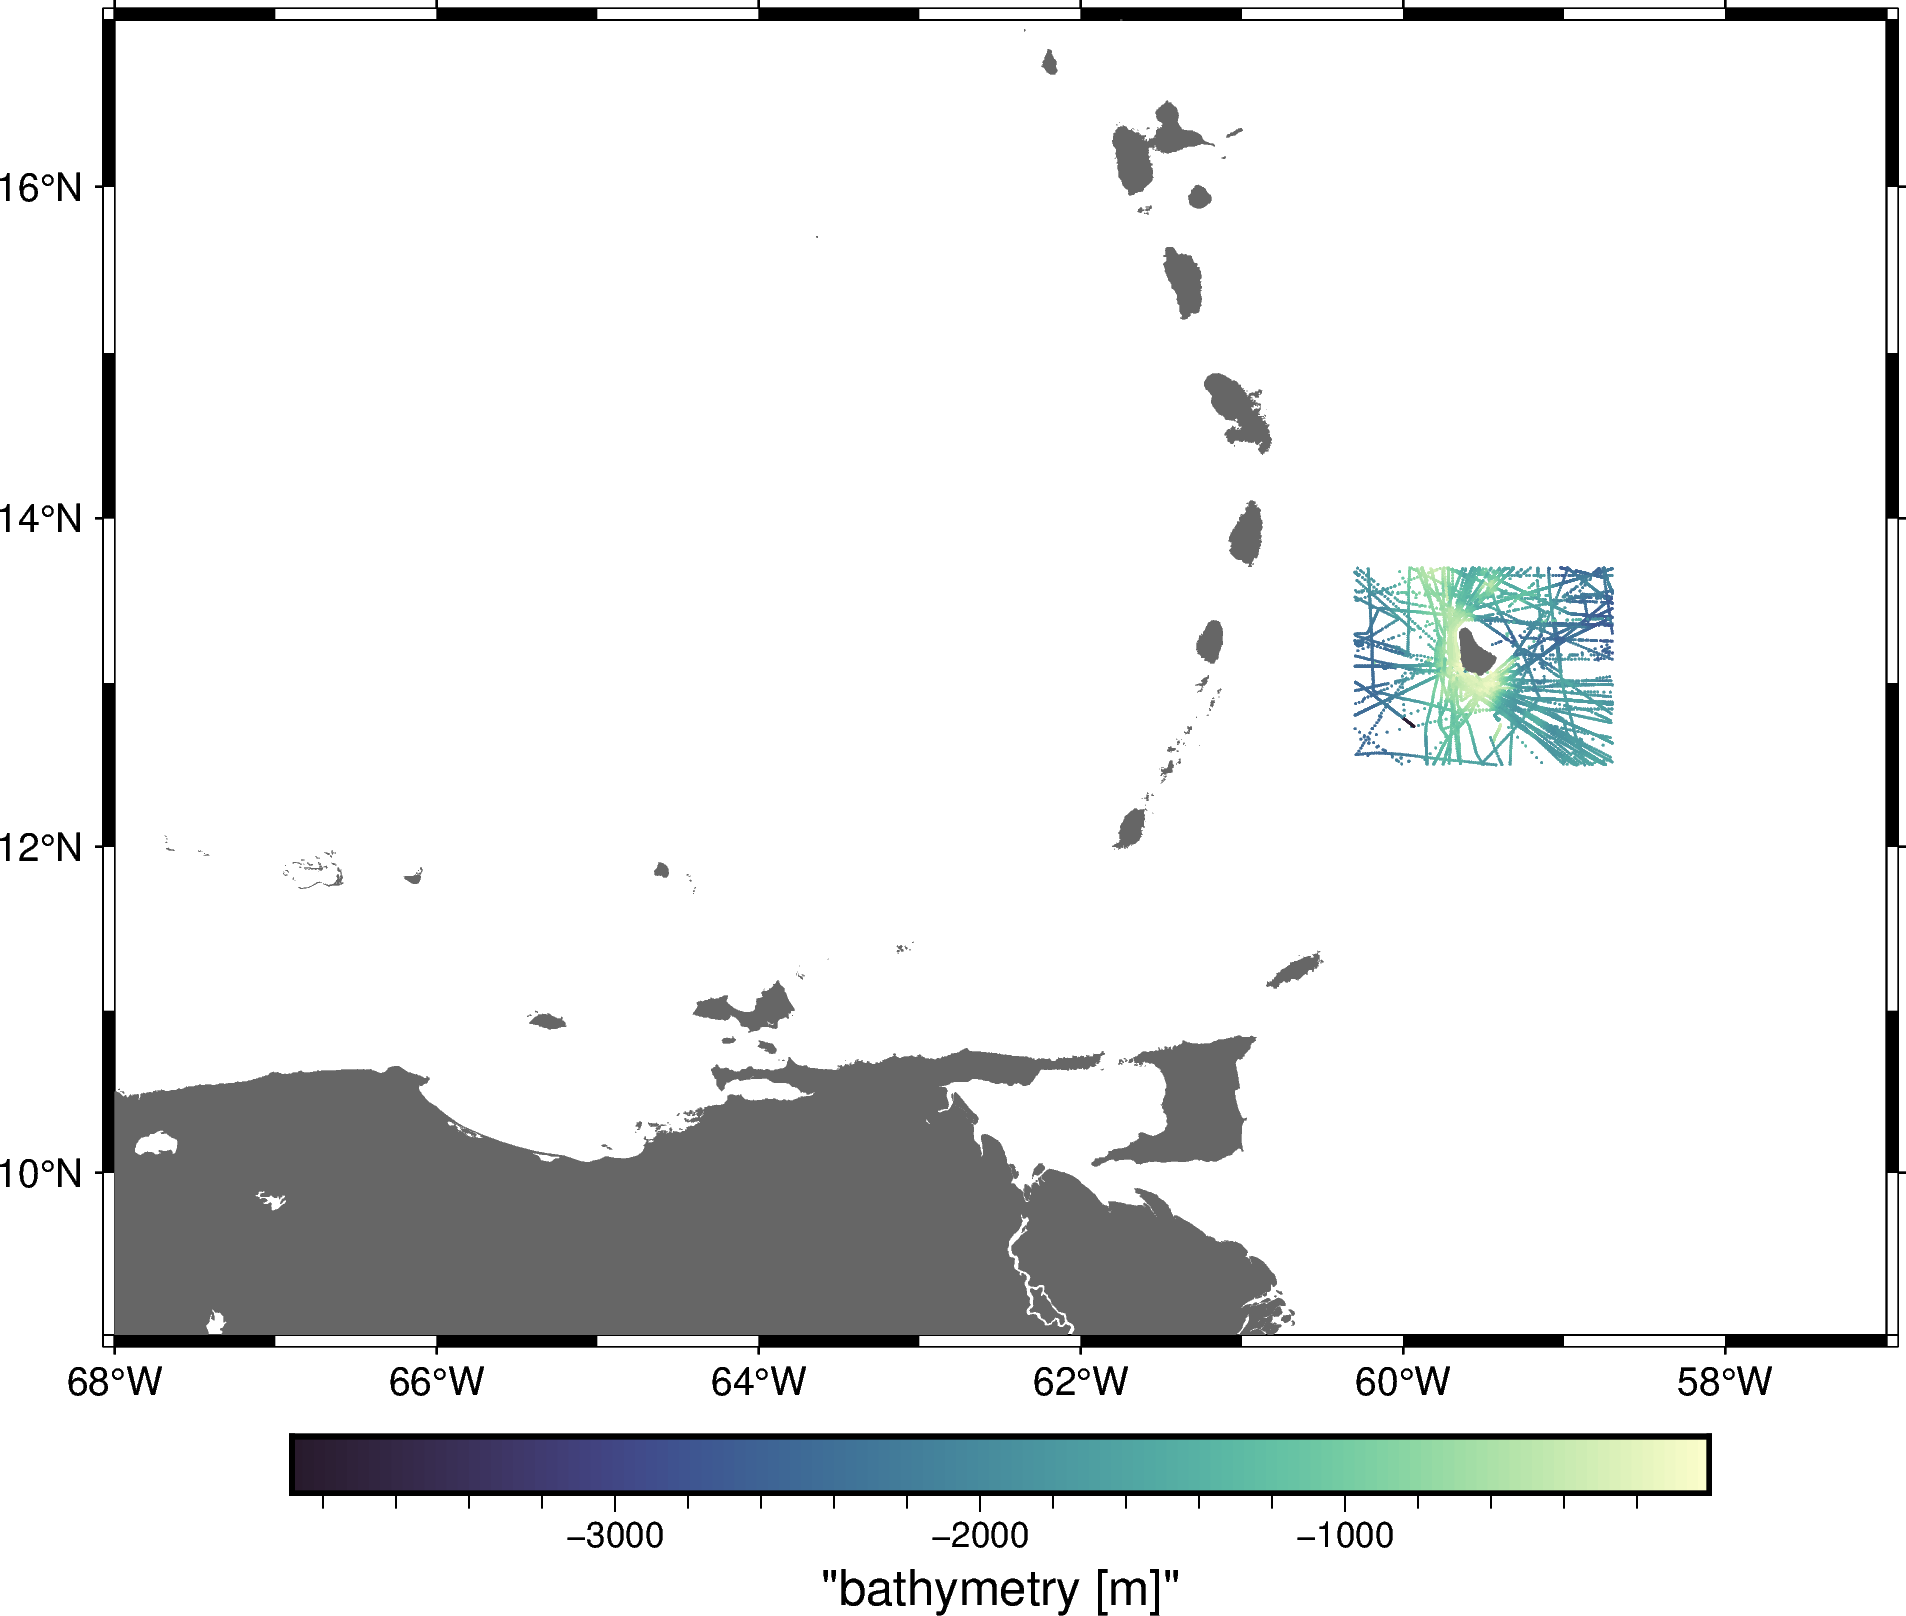
Now, let’s say we wanted only the data that around Barbados. We may have the exact region that we want to crop the data:
region_barbados = (-60.3, -58.7, 12.5, 13.7) # W, E, S, N
We can use bordado.inside to get an index for our dataset that will
select only data inside the given region:
barbados = bd.inside(
    coordinates=(data.longitude, data.latitude),
    region=region_barbados,
)
barbados
array([False, False, False, ..., False, False, False], shape=(294321,))
With the index, we can select the data like so:
data_barbados = data[barbados]
data_barbados
| survey_id | latitude | longitude | bathymetry_m | |
|---|---|---|---|---|
| 11349 | 19920018 | 13.21314 | -60.11236 | -2396 |
| 11350 | 19920018 | 13.22323 | -60.16074 | -2406 |
| 11351 | 19920018 | 13.23367 | -60.21238 | -2396 |
| 11352 | 19920018 | 13.24463 | -60.26391 | -2396 |
| 13175 | ODP156JR | 13.68979 | -59.54782 | -1469 |
| ... | ... | ... | ... | ... |
| 290849 | 80003511 | 13.63710 | -58.74000 | -2198 |
| 290850 | 80003511 | 13.63640 | -58.73740 | -2184 |
| 290851 | 80003511 | 13.63580 | -58.73490 | -2174 |
| 290852 | 80003511 | 13.63520 | -58.73240 | -2145 |
| 290853 | 80003511 | 13.63470 | -58.72980 | -2098 |
11615 rows × 4 columns
And plot the selected data:
fig = pygmt.Figure()
pygmt.makecpt(
    cmap="cmocean/topo+h",
    series=[
        data_barbados.bathymetry_m.min(),
        data_barbados.bathymetry_m.max(),
    ],
)
fig.plot(
    x=data_barbados.longitude,
    y=data_barbados.latitude,
    fill=data_barbados.bathymetry_m,
    cmap=True,
    style="c0.02c",
    projection="M15c",
    region=region,
    frame=True,
)
fig.colorbar(frame=["af+lBathymetry", "y+lm"])
fig.coast(land="#666666")
fig.show()
Hint
The order of the coordinates must be the same as the order of elements in the region. If the region is W, E, S, N, then the coordinates must be longitude and then latitude.