Note
Click here to download the full example code
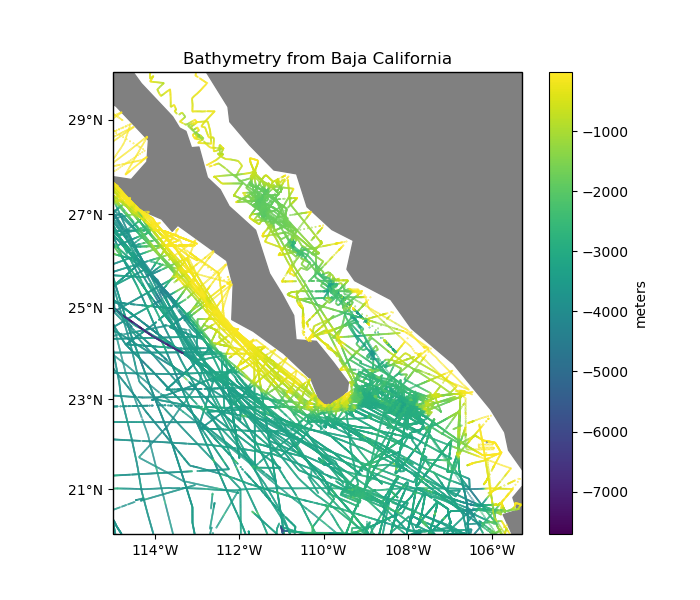
Bathymetry data from Baja California
We provide sample bathymetry data from Baja California to test the gridding
methods. This is the @tut_ship.xyz sample data from the GMT tutorial. The data is downloaded to a local
directory if it’s not there already.
Out:
   longitude  latitude  bathymetry_m
0  245.00891  27.49555        -636.0
1  245.01201  27.49286        -655.0
2  245.01512  27.49016        -710.0
3  245.01822  27.48746        -695.0
4  245.02443  27.48206        -747.0
/home/travis/miniconda/envs/testing/lib/python3.6/site-packages/cartopy/mpl/geoaxes.py:782: MatplotlibDeprecationWarning: Passing the minor parameter of set_xticks() positionally is deprecated since Matplotlib 3.2; the parameter will become keyword-only two minor releases later.
  return super(GeoAxes, self).set_xticks(xticks, minor)
/home/travis/miniconda/envs/testing/lib/python3.6/site-packages/cartopy/mpl/geoaxes.py:829: MatplotlibDeprecationWarning: Passing the minor parameter of set_yticks() positionally is deprecated since Matplotlib 3.2; the parameter will become keyword-only two minor releases later.
  return super(GeoAxes, self).set_yticks(yticks, minor)
/home/travis/build/fatiando/verde/data/examples/baja_bathymetry.py:35: UserWarning: Tight layout not applied. The left and right margins cannot be made large enough to accommodate all axes decorations.
  plt.tight_layout()
import matplotlib.pyplot as plt
import cartopy.crs as ccrs
import verde as vd


# The data are in a pandas.DataFrame
data = vd.datasets.fetch_baja_bathymetry()
print(data.head())

# Make a Mercator map of the data using Cartopy
plt.figure(figsize=(7, 6))
ax = plt.axes(projection=ccrs.Mercator())
ax.set_title("Bathymetry from Baja California")
# Plot the bathymetry as colored circles. Cartopy requires setting the projection of the
# original data through the transform argument. Use PlateCarree for geographic data.
plt.scatter(
    data.longitude,
    data.latitude,
    c=data.bathymetry_m,
    s=0.1,
    transform=ccrs.PlateCarree(),
)
plt.colorbar().set_label("meters")
# Use an utility function to add tick labels and land and ocean features to the map.
vd.datasets.setup_baja_bathymetry_map(ax)
plt.tight_layout()
plt.show()
Total running time of the script: ( 0 minutes 1.176 seconds)