Note
Click here to download the full example code
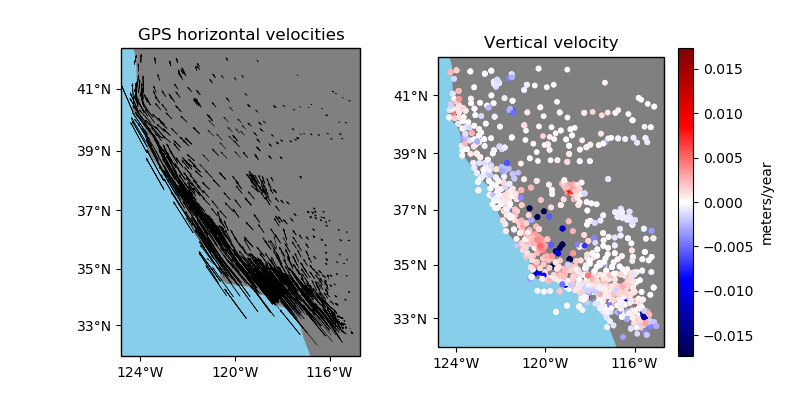
GPS velocities from California
We provide sample 3-component GPS velocity data from the West coast of the U.S. The data were cut from EarthScope Plate Boundary Observatory data provided by UNAVCO. The velocities are in the North American tectonic plate reference system (NAM08). The velocities and their associated standard deviations are in meters/year.
Out:
    latitude   longitude     height  ...  std_north  std_east   std_up
0  34.116409  242.906804  762.11978  ...     0.0002   0.00037  0.00053
1  34.116409  242.906804  762.10883  ...     0.0002   0.00037  0.00053
2  34.116409  242.906805  762.09364  ...     0.0002   0.00037  0.00053
3  34.116409  242.906805  762.09073  ...     0.0002   0.00037  0.00053
4  34.116409  242.906805  762.07699  ...     0.0002   0.00037  0.00053

[5 rows x 9 columns]
/home/travis/build/fatiando/verde/data/examples/california_gps.py:54: UserWarning: Tight layout not applied. The left and right margins cannot be made large enough to accommodate all axes decorations.
  plt.tight_layout(w_pad=0)
import matplotlib.pyplot as plt
import cartopy.crs as ccrs
import numpy as np
import verde as vd


# The data are in a pandas.DataFrame
data = vd.datasets.fetch_california_gps()
print(data.head())


# Make a plot of the data using Cartopy to handle projections and coastlines
crs = ccrs.PlateCarree()
fig, axes = plt.subplots(
    1, 2, figsize=(8, 4), subplot_kw=dict(projection=ccrs.Mercator())
)
# Plot the horizontal velocity vectors
ax = axes[0]
ax.set_title("GPS horizontal velocities")
ax.quiver(
    data.longitude.values,
    data.latitude.values,
    data.velocity_east.values,
    data.velocity_north.values,
    scale=0.3,
    transform=crs,
)
vd.datasets.setup_california_gps_map(ax)
# Plot the vertical velocity
ax = axes[1]
ax.set_title("Vertical velocity")
maxabs = vd.maxabs(data.velocity_up)
tmp = ax.scatter(
    data.longitude,
    data.latitude,
    c=data.velocity_up,
    s=10,
    vmin=-maxabs / 3,
    vmax=maxabs / 3,
    cmap="seismic",
    transform=crs,
)
plt.colorbar(tmp, ax=ax).set_label("meters/year")
vd.datasets.setup_california_gps_map(ax)
plt.tight_layout(w_pad=0)
plt.show()
Total running time of the script: ( 0 minutes 0.289 seconds)