Note
Click here to download the full example code
Evaluating Performance
The Green’s functions based interpolations in Verde are all linear regressions under the
hood. This means that we can use some of the same tactics from
sklearn.model_selection to evaluate our interpolator’s performance. Once we have
a quantified measure of the quality of a given fitted gridder, we can use it to tune the
gridder’s parameters, like damping for a Spline (see
Model Selection).
Verde provides adaptations of common scikit-learn tools to work better with spatial
data. Let’s use these tools to evaluate the performance of a Spline on
our sample air temperature data.
import numpy as np
import matplotlib.pyplot as plt
import cartopy.crs as ccrs
import pyproj
import verde as vd

data = vd.datasets.fetch_texas_wind()

# Use Mercator projection because Spline is a Cartesian gridder
projection = pyproj.Proj(proj="merc", lat_ts=data.latitude.mean())
proj_coords = projection(data.longitude.values, data.latitude.values)

region = vd.get_region((data.longitude, data.latitude))
# For this data, we'll generate a grid with 15 arc-minute spacing
spacing = 15 / 60
Splitting the data
We can’t evaluate a gridder on the data that went into fitting it. The true test of a
model is if it can correctly predict data that it hasn’t seen before. scikit-learn has
the sklearn.model_selection.train_test_split function to separate a dataset
into two parts: one for fitting the model (called training data) and a separate one
for evaluating the model (called testing data). Using it with spatial data would
involve some tedious array conversions so Verde implements
verde.train_test_split which does the same thing but takes coordinates and
data arrays instead.
The split is done randomly so we specify a seed for the random number generator to
guarantee that we’ll get the same result every time we run this example. You probably
don’t want to do that for real data. We’ll keep 30% of the data to use for testing
(test_size=0.3).
train, test = vd.train_test_split(
    proj_coords, data.air_temperature_c, test_size=0.3, random_state=0
)
The returned train and test variables are tuples containing coordinates, data,
and (optionally) weights arrays. Since we’re not using weights, the third element of
the tuple will be None:
print(train)
Out:
((array([ -9471409.04145469,  -9242651.69892226,  -9518618.69368063,
        -9226352.10603726,  -9196090.97662381,  -9211980.21676048,
        -9111443.79343314,  -9285738.73749109,  -9261270.26198931,
        -9322307.84752338,  -9449918.0091497 ,  -9210462.86590059,
        -9437254.33247619,  -9336002.17761117,  -9770852.03064925,
        -9286998.42499748,  -9121969.81858082,  -9225655.46067393,
        -9784479.55912689,  -9724577.60096593,  -9119011.46155829,
        -9366406.45333221,  -9104334.19349208,  -9468488.85678097,
        -9512730.60889723,  -9752004.43349022,  -9474730.03578958,
        -9295711.26358295,  -9407680.3053389 ,  -9409483.94881389,
        -9113314.23851832,  -9581641.24134595,  -9051780.41245142,
        -9151620.1904154 ,  -9526253.16341599,  -9370920.33356321,
        -9422548.43514848,  -9363887.07831951,  -9926719.2733836 ,
        -9263865.98169933, -10151535.32091524,  -9105488.90703954,
        -9399024.72527645,  -9275584.89274308,  -9287132.02821771,
        -9254036.60191507,  -9356519.81502484,  -9300826.35830558,
        -9088836.21992941,  -9329331.55967991,  -9705882.69320157,
        -9544881.26957023,  -9339151.39637705,  -9260420.92723128,
        -9092882.48888909,  -9202923.82703691,  -9252023.01052236,
        -9250143.02235004,  -9110031.41653214,  -9210586.92603379,
        -9192082.88001273,  -9144987.74483283,  -9265793.68530754,
        -9038200.59940965,  -9241182.06349818,  -9289031.10256449,
        -9405189.55958775,  -9354792.51624734,  -9330810.73819114,
        -9321372.62498082,  -9228556.55917334,  -9199536.03109192,
        -9278581.42211417,  -9229978.47916156,  -9319244.51654206,
        -9297171.35591977,  -9275775.75448643,  -9559682.59776963,
        -9197073.91460223,  -9491697.64477644,  -9185221.40033809,
        -9486172.19730542,  -9098512.91031894,  -9357970.36427462,
        -9348971.2330741 ,  -9415391.11977161,  -9570580.80331691,
        -9298450.12960044,  -9786178.22864295,  -9638164.94664898,
        -9374995.23178449,  -9135062.93417687,  -9363782.10436067,
        -9061161.26713871,  -9641390.51011218,  -9244388.54078699,
        -9743587.43060695,  -9128583.17798902,  -9688294.78354872,
        -9878049.52882075,  -9261222.54655341,  -9959308.91606633,
        -9374995.23178449,  -9324979.91193077, -10002090.57584577,
        -9291378.70200816,  -9717038.56210237,  -9108943.50459486,
        -9187130.01777196,  -9178474.43770947,  -9821430.39264604,
        -9676089.17505937,  -9590325.45066986,  -9334752.033192  ,
        -9349658.33535028,  -9217667.89671333,  -9192989.47329381,
        -9735189.51389807,  -9062249.17907602,  -9332852.95884533,
        -9455815.63702027,  -9796236.64251932,  -9443505.05457202,
        -9320723.69505337,  -9754266.14514927,  -9765097.54908629,
        -9081077.6900608 ,  -9042075.09280036,  -9433427.55452137,
        -9587615.21391383]), array([2657710.28293861, 3302077.73567252, 2899046.15133399,
       2838589.68737716, 3049850.71722841, 3290767.45780106,
       2931160.45084784, 3271137.71227972, 3285325.92731206,
       3104893.52310543, 3247812.59589509, 3166662.55342553,
       3287606.04132201, 3103141.68482877, 3197876.76156001,
       3149242.24908431, 3067381.83156894, 3400585.90023853,
       3243911.5995015 , 3290869.09139339, 2992634.70248073,
       3169418.17605082, 3246497.10552017, 2817264.46474637,
       3252930.02674656, 3200327.43647367, 3459184.29516942,
       3112292.18628403, 2917869.77563751, 3197809.62807528,
       3290225.42947942, 3652939.53050434, 3222645.66433888,
       2963817.97546003, 2824339.57488837, 3107155.82534808,
       2698337.04679593, 2601703.23660133, 3025820.22660258,
       3166283.29483646, 3185632.21052805, 3023883.40574366,
       3417009.35720713, 3393428.62105992, 3316162.95136998,
       3082031.84084665, 2953318.41751121, 2933549.90421567,
       2932676.98398158, 3020406.81467849, 3574040.01091358,
       2790505.48355738, 2973418.65910264, 3307698.11129963,
       2945505.02203083, 3311522.23776724, 2975313.52946633,
       2861050.32840049, 2887880.3960125 , 2945898.28967202,
       2941474.84700705, 3225124.76062141, 3281387.74953726,
       3159592.7976058 , 3315823.31326006, 2571845.86314015,
       3331844.27865595, 2740231.34771917, 3387759.04557859,
       3060081.02436476, 3041845.53079301, 3210124.8374159 ,
       3164074.94938398, 3271836.50108902, 2579123.45324659,
       2545954.59014788, 3342747.49976745, 2979356.30060547,
       3009203.6131726 , 2719110.10495866, 2846814.97160994,
       3188985.42191104, 2983466.36042869, 3294675.45126596,
       3039773.54716658, 3071437.56540843, 3483134.04990316,
       3294607.6695262 , 3667917.1194501 , 3619924.68699415,
       2573548.51452294, 2821249.74463367, 2683074.91768678,
       3285461.36507139, 3652271.03785312, 3283204.30900926,
       3210853.02111693, 2943844.71518428, 3230601.11578242,
       3137567.17555595, 2777047.34270749, 2945144.53916802,
       3066497.95513723, 3110760.99744545, 3188091.12461515,
       3298991.83921469, 3394820.85278175, 3391739.95155904,
       3286590.08456857, 3389059.21988513, 3085628.36101872,
       3630202.83368938, 3134419.72201147, 3256654.45390054,
       2573738.88783378, 3339785.07776942, 3063935.13249589,
       3648601.05705207, 3330211.5352512 , 3142162.17467495,
       2982622.30031315, 3282673.97488324, 3183676.67838886,
       3006522.74236789, 2990221.2234946 , 3532083.29147308,
       2942206.50247381, 3121339.67312345, 2913261.59698676,
       3259243.23756798])), (array([18.15166667, 12.17857143, 16.45916667, 16.60084507, 12.41170213,
        9.67159091, 16.33043478,  9.43978723, 11.10313725, 10.22955556,
       11.57575758, 12.47194444, 12.22138889, 10.36794118,  8.775     ,
       10.46055556, 12.55241379, 11.78611111,  7.89736111,  7.06944444,
       14.57882353, 12.33319444, 11.96138889, 16.88692308, 10.20833333,
        9.1525    ,  9.64888889, 10.29677419, 15.16444444, 12.81565217,
       10.        ,  3.16277778, 13.49071429, 14.98529412, 16.66666667,
       13.06835821, 16.63416667, 20.43375   ,  5.96285714, 13.76470588,
        9.16391304, 13.8736    , 10.99888889, 11.23633803,  9.751875  ,
       12.43888889, 10.94418605, 15.23805556, 16.66589744, 11.40892857,
        4.984     , 18.08955224, 11.45891304, 12.05545455, 16.13939394,
       11.18275362, 14.49676056, 15.90777778, 18.8625    , 14.27527778,
       14.97291667, 10.73239437,  8.98125   , 11.89032258, 11.46025641,
       22.6082    , 10.77111111, 16.40823529,  9.23611111, 10.82863636,
       12.57958333, 11.18545455, 11.13193548, 10.56277778, 20.97333333,
       23.26113208, 10.365     , 14.46875   , 14.21430556, 16.8525    ,
       17.01530612, 12.83722222, 15.22228571,  9.005     , 14.1       ,
       14.19444444,  9.02333333, 12.11923077,  2.1525    ,  5.64638889,
       21.09483871, 19.73611111, 18.09676056, 11.48449275,  4.29166667,
        9.78117647, 10.1875    , 16.36536585,  8.73277778,  7.70694444,
       17.2974    , 15.35777778, 14.53130435, 16.58333333,  7.52666667,
       11.37028571,  5.79375   ,  8.54088235,  9.196     , 10.37263889,
       11.39375   ,  7.08166667, 11.74291667, 10.86027778, 20.47454545,
       10.9936    , 12.47652778,  3.43633803, 10.0825    ,  9.59677419,
       13.55277778,  6.09319444, 20.58333333, 11.65820513, 14.4926087 ,
        3.14875   , 16.80952381, 12.45724138, 15.76208333, 11.69902778]),), (None,))
print(test)
Out:
((array([ -9355174.23973406,  -9305731.50511056,  -9378946.06987249,
        -9894654.50049513,  -9357159.20186525,  -9310436.24708494,
        -9176098.20900436,  -9848465.95859632,  -9657890.50782771,
        -9408987.70828107,  -9592090.92179618,  -9397058.84931958,
        -9614660.3229513 ,  -9438991.174341  ,  -9220530.82286406,
        -9464280.35533937,  -9148327.82534205,  -9254885.93667311,
        -9284574.48085645,  -9103675.72047743,  -9617332.38735867,
        -9038401.00424027,  -9631570.67341502,  -9133335.63539924,
        -9125099.95117223,  -9369183.49169843,  -8985427.32736408,
        -9520794.51755526,  -9397182.90945276,  -8972410.55646536,
        -9418511.70927591,  -9312192.17512406,  -9633794.21272551,
        -9386466.02256181,  -9298192.46624686, -10151936.13057628,
        -9335849.48821648,  -9334064.93091582,  -8951759.31583123,
        -9066696.25769683,  -9086927.60249552,  -9399253.75936852,
        -9167595.31833663,  -9052610.66103518,  -9401849.47907855,
        -9332280.37361521,  -8991029.11953241,  -8973832.47645352,
        -9529249.69278712,  -9266070.43483542,  -9429505.34569483,
        -8999875.56133822,  -9322689.57101016,  -9604983.63256177,
        -9104467.79671247,  -9706970.60513881]), array([2719870.27460582, 2743685.56324252, 2933768.14517002,
       3027361.13101297, 2757426.84021469, 3028296.78889616,
       2903724.5557224 , 3182157.20869187, 3066100.23492454,
       3255225.28091213, 2860584.19616269, 2934171.90242784,
       3714012.76916745, 3011874.16439619, 3080991.84629854,
       2915167.81938923, 2873187.46869299, 3003831.55941359,
       2735051.95799933, 2953788.49303643, 2915178.71303919,
       3249859.25595487, 2916780.19714376, 3182123.69352164,
       3337515.62533228, 3230904.19741824, 3187923.45258656,
       3041327.49695636, 2912727.91396922, 2979696.00616845,
       2954947.37073634, 3348209.3192316 , 3284716.48014213,
       3043124.19066597, 3246452.13452785, 3189924.51834186,
       3339251.70946121, 2715192.27113021, 2992766.36237038,
       3024323.56139651, 3192216.72345509, 3430837.16378734,
       3327060.19688609, 2904921.67586422, 2871114.86619099,
       2807032.29570529, 2992876.08017689, 3082728.91614068,
       3254021.33225593, 3216131.11265389, 3253177.52895142,
       3265222.50231349, 2744264.94274218, 3049585.98626738,
       3129450.24999779, 3452568.99011507])), (array([17.71611111, 17.3918    , 10.73421875,  8.08555556, 16.258125  ,
       16.18181818, 15.87828571,  7.47625   , 11.02857143, 12.25472222,
       17.16923077, 15.60208333,  5.04152778, 13.14263889, 12.47835821,
       16.69304348, 18.73916667, 11.46194444, 18.38255319, 16.02173913,
       16.57884615, 10.55866667, 16.48916667, 13.43583333, 10.67041667,
       11.90319444, 11.49557143, 12.17826087, 14.27805556, 17.43382353,
       12.95833333, 11.04708333,  9.60486111, 13.46      , 10.58730159,
        7.39333333, 10.11722222, 17.7375    , 17.10013889, 14.64180556,
       12.44957143,  9.68391304, 11.93055556, 20.34757576, 15.4025    ,
       16.76319444, 17.33347222, 13.55152778, 10.49541667, 11.92041667,
       10.42583333, 12.69078125, 17.22138889, 10.33333333, 12.80555556,
        3.85638889]),), (None,))
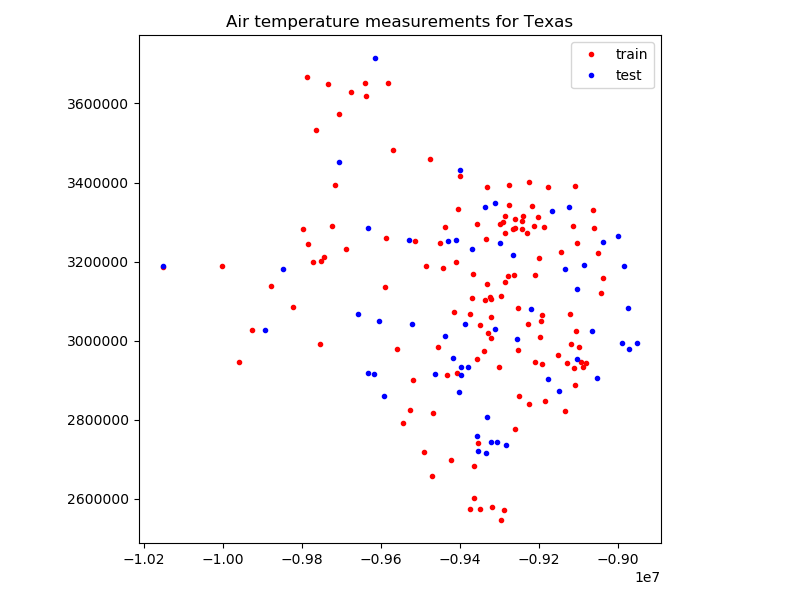
Let’s plot these two datasets with different colors:
plt.figure(figsize=(8, 6))
ax = plt.axes()
ax.set_title("Air temperature measurements for Texas")
ax.plot(train[0][0], train[0][1], ".r", label="train")
ax.plot(test[0][0], test[0][1], ".b", label="test")
ax.legend()
ax.set_aspect("equal")
plt.tight_layout()
plt.show()
We can pass the training dataset to the fit method of
most gridders using Python’s argument expansion using the * symbol.
spline = vd.Spline()
spline.fit(*train)
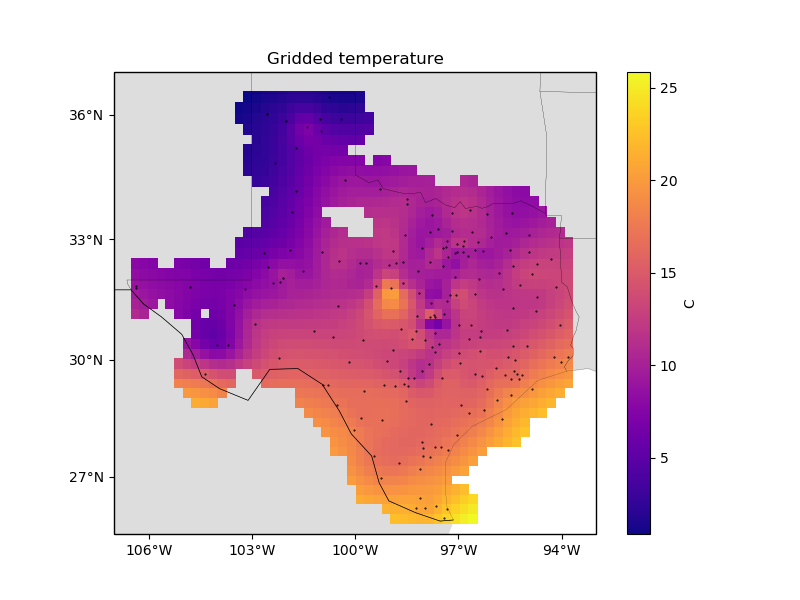
Let’s plot the gridded result to see what it looks like. First, we’ll create a geographic grid:
grid = spline.grid(
    region=region,
    spacing=spacing,
    projection=projection,
    dims=["latitude", "longitude"],
    data_names=["temperature"],
)
print(grid)
Out:
<xarray.Dataset>
Dimensions:      (latitude: 43, longitude: 51)
Coordinates:
  * longitude    (longitude) float64 -106.4 -106.1 -105.9 ... -94.06 -93.8
  * latitude     (latitude) float64 25.91 26.16 26.41 ... 35.91 36.16 36.41
Data variables:
    temperature  (latitude, longitude) float64 36.72 36.32 35.92 ... 4.568 4.711
Attributes:
    metadata:  Generated by Spline(damping=None, engine='auto', force_coords=...
Then, we’ll mask out grid points that are too far from any given data point and plot the grid:
mask = vd.distance_mask(
    (data.longitude, data.latitude),
    maxdist=3 * spacing * 111e3,
    coordinates=vd.grid_coordinates(region, spacing=spacing),
    projection=projection,
)
grid = grid.where(mask)

plt.figure(figsize=(8, 6))
ax = plt.axes(projection=ccrs.Mercator())
ax.set_title("Gridded temperature")
pc = grid.temperature.plot.pcolormesh(
    ax=ax,
    cmap="plasma",
    transform=ccrs.PlateCarree(),
    add_colorbar=False,
    add_labels=False,
)
plt.colorbar(pc).set_label("C")
ax.plot(data.longitude, data.latitude, ".k", markersize=1, transform=ccrs.PlateCarree())
vd.datasets.setup_texas_wind_map(ax)
plt.tight_layout()
plt.show()
Out:
/home/travis/build/fatiando/verde/tutorials/model_evaluation.py:123: UserWarning: Tight layout not applied. The left and right margins cannot be made large enough to accommodate all axes decorations.
  plt.tight_layout()
Scoring
Gridders in Verde implement the score method that
calculates the R² coefficient of determination
for a given comparison dataset (test in our case). The R² score is at most 1,
meaning a perfect prediction, but has no lower bound.
score = spline.score(*test)
print("R² score:", score)
Out:
R² score: 0.8404552995027369
That’s a good score meaning that our gridder is able to accurately predict data that wasn’t used in the gridding algorithm.
Caution
Once caveat for this score is that it is highly dependent on the particular split
that we made. Changing the random number generator seed in
verde.train_test_split will result in a different score.
# Use 1 as a seed instead of 0
train_other, test_other = vd.train_test_split(
    proj_coords, data.air_temperature_c, test_size=0.3, random_state=1
)

print("R² score with seed 1:", vd.Spline().fit(*train_other).score(*test_other))
Out:
R² score with seed 1: 0.7832246926655104
Cross-validation
A more robust way of scoring the gridders is to use function
verde.cross_val_score, which (by default) uses a k-fold cross-validation
by default. It will split the data k times and return the score on each fold. We
can then take a mean of these scores.
scores = vd.cross_val_score(vd.Spline(), proj_coords, data.air_temperature_c)
print("k-fold scores:", scores)
print("Mean score:", np.mean(scores))
Out:
k-fold scores: [0.81655898 0.72019255 0.81596348 0.87740087 0.75006854]
Mean score: 0.7960368854827115
You can also use most cross-validation splitter classes from
sklearn.model_selection by specifying the cv argument. For example, if we
want to shuffle then split the data n times
(sklearn.model_selection.ShuffleSplit):
from sklearn.model_selection import ShuffleSplit

shuffle = ShuffleSplit(n_splits=10, test_size=0.3, random_state=0)

scores = vd.cross_val_score(
    vd.Spline(), proj_coords, data.air_temperature_c, cv=shuffle
)
print("shuffle scores:", scores)
print("Mean score:", np.mean(scores))
Out:
shuffle scores: [0.8404553  0.79219264 0.60098099 0.73123421 0.67325199 0.70560489
 0.68905622 0.83517217 0.86908658 0.84133251]
Mean score: 0.757836751697831
That is not a very good score so clearly the default arguments for
Spline aren’t suitable for this dataset. We could try different
combinations manually until we get a good score. A better way is to do this
automatically. In Model Selection we’ll go over how to do that.
Total running time of the script: ( 0 minutes 0.564 seconds)