Note
Click here to download the full example code
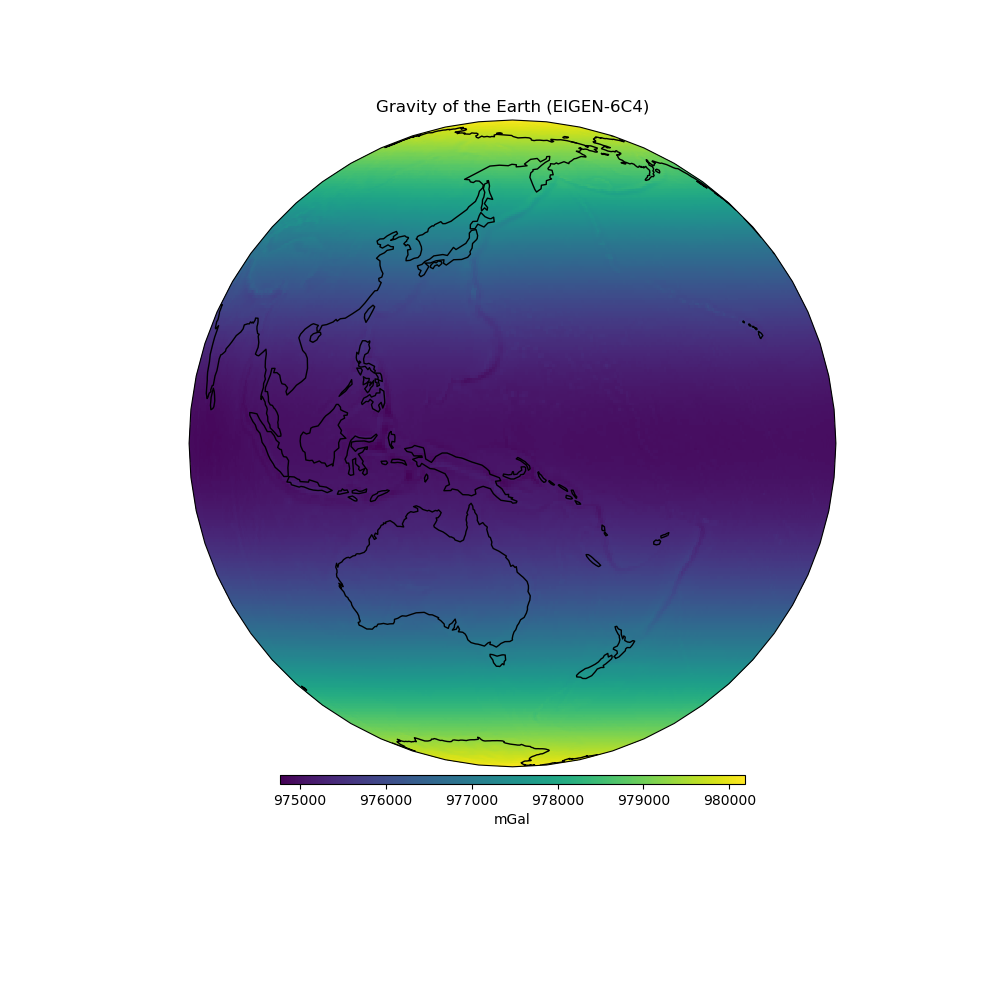
Earth Gravity
This is the magnitude of the gravity vector of the Earth (gravitational + centrifugal) at 10 km height. The data is on a regular grid with 0.5 degree spacing at 10km ellipsoidal height. It was generated from the spherical harmonic model EIGEN-6C4 [Forste_etal2014].
Out:
<xarray.Dataset>
Dimensions:          (latitude: 361, longitude: 721)
Coordinates:
  * longitude        (longitude) float64 -180.0 -179.5 -179.0 ... 179.5 180.0
  * latitude         (latitude) float64 -90.0 -89.5 -89.0 ... 89.0 89.5 90.0
Data variables:
    gravity          (latitude, longitude) float64 9.801e+05 ... 9.802e+05
    height_over_ell  (latitude, longitude) float64 1e+04 1e+04 ... 1e+04 1e+04
Attributes: (12/35)
    generating_institute:  gfz-potsdam
    generating_date:       2018/11/07
    product_type:          gravity_field
    body:                  earth
    modelname:             EIGEN-6C4
    max_used_degree:       1277
    ...                    ...
    maxvalue:              9.8018358E+05 mgal
    minvalue:              9.7476403E+05 mgal
    signal_wrms:           1.5467865E+03 mgal
    grid_format:           long_lat_value
    attributes:            longitude latitude gravity_ell
    attributes_units:      deg. deg. mgal
import matplotlib.pyplot as plt
import cartopy.crs as ccrs
import harmonica as hm

# Load the gravity grid
data = hm.datasets.fetch_gravity_earth()
print(data)

# Make a plot of data using Cartopy
plt.figure(figsize=(10, 10))
ax = plt.axes(projection=ccrs.Orthographic(central_longitude=150))
pc = data.gravity.plot.pcolormesh(
    ax=ax, transform=ccrs.PlateCarree(), add_colorbar=False
)
plt.colorbar(
    pc, label="mGal", orientation="horizontal", aspect=50, pad=0.01, shrink=0.6
)
ax.set_title("Gravity of the Earth (EIGEN-6C4)")
ax.coastlines()
plt.show()
Total running time of the script: ( 0 minutes 0.705 seconds)