Note
Click here to download the full example code
Layer of prisms
One way to model three dimensional structures is to create a set of prisms that
approximates their geometry and its physical properties (density,
susceptibility, etc.). The harmonica.prism_layer offers a simple way
to create a layer of prisms: a regular grid of prisms of equal size on the
horizontal directions with variable top and bottom boundaries. It returns
a xarray.Dataset with the coordinates of the centers of the prisms and
their corresponding physical properties.
The harmonica.DatasetAccessorPrismsLayer Dataset accessor can be used
to obtain some properties of the layer like its shape and size or the
boundaries of any prism in the layer. The methods of this Dataset accessor can
be used together with the harmonica.prism_gravity to compute the
gravitational effect of the layer.
Out:
/home/runner/work/harmonica/harmonica/examples/forward/prism_layer.py:48: MatplotlibDeprecationWarning: shading='flat' when X and Y have the same dimensions as C is deprecated since 3.3.  Either specify the corners of the quadrilaterals with X and Y, or pass shading='auto', 'nearest' or 'gouraud', or set rcParams['pcolor.shading'].  This will become an error two minor releases later.
  plt.pcolormesh(*coordinates[:2], gravity)
import numpy as np
import verde as vd
import harmonica as hm
import matplotlib.pyplot as plt
# Create a layer of prisms
region = (0, 100e3, -40e3, 40e3)
spacing = 2e3
(easting, northing) = vd.grid_coordinates(region=region, spacing=spacing)
surface = 100 * np.exp(-((easting - 50e3) ** 2 + northing ** 2) / 1e9)
density = 2670.0 * np.ones_like(surface)
prisms = hm.prism_layer(
coordinates=(easting[0, :], northing[:, 0]),
surface=surface,
reference=0,
properties={"density": density},
)
# Compute gravity field of prisms on a regular grid of observation points
coordinates = vd.grid_coordinates(region, spacing=spacing, extra_coords=1e3)
gravity = prisms.prism_layer.gravity(coordinates, field="g_z")
# Plot gravity field
plt.pcolormesh(*coordinates[:2], gravity)
plt.colorbar(label="mGal", shrink=0.8)
plt.gca().set_aspect("equal")
plt.ticklabel_format(axis="both", style="sci", scilimits=(0, 0))
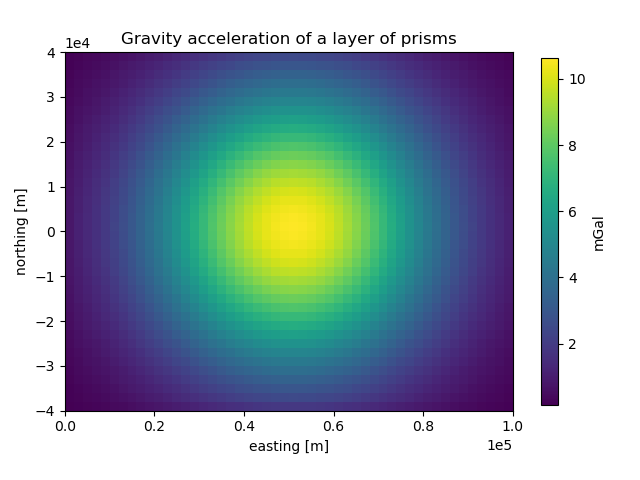
plt.title("Gravity acceleration of a layer of prisms")
plt.xlabel("easting [m]")
plt.ylabel("northing [m]")
plt.tight_layout()
plt.show()
Total running time of the script: ( 0 minutes 1.252 seconds)