<xarray.DataArray 'gravity' (latitude: 1081, longitude: 2161)>
array([[980106.5 , 980106.5 , 980106.5 , ..., 980106.5 , 980106.5 ,
980106.5 ],
[980108.25, 980108.25, 980108.25, ..., 980108.25, 980108.25,
980108.25],
[980108.8 , 980108.8 , 980108.8 , ..., 980108.75, 980108.75,
980108.8 ],
...,
[980153.8 , 980153.75, 980153.6 , ..., 980153.94, 980153.8 ,
980153.8 ],
[980160.44, 980160.44, 980160.44, ..., 980160.44, 980160.44,
980160.44],
[980157.5 , 980157.5 , 980157.5 , ..., 980157.5 , 980157.5 ,
980157.5 ]], dtype=float32)
Coordinates:
* longitude (longitude) float64 -180.0 -179.8 -179.7 ... 179.7 179.8 180.0
* latitude (latitude) float64 -90.0 -89.83 -89.67 -89.5 ... 89.67 89.83 90.0
height (latitude, longitude) float32 1e+04 1e+04 1e+04 ... 1e+04 1e+04
Attributes:
Conventions: CF-1.8
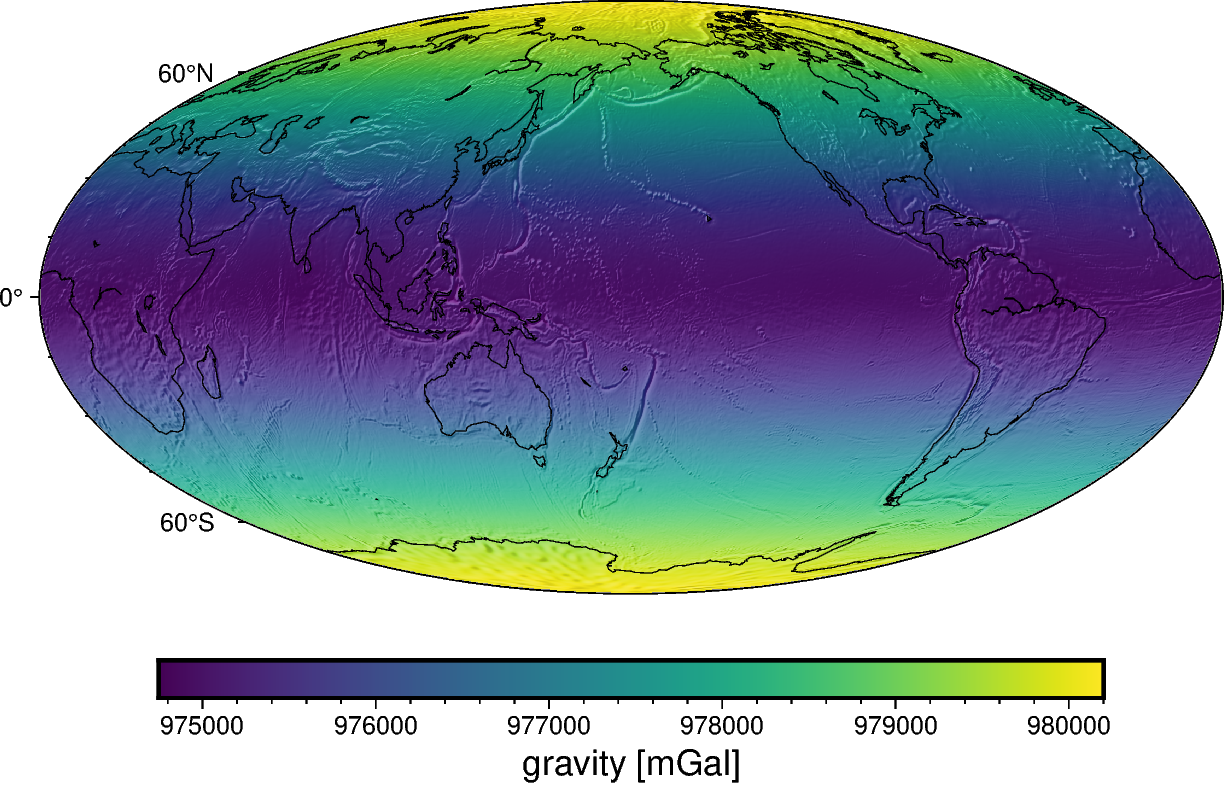
title: Gravity acceleration (EIGEN-6C4) at a constant geometric...
crs: WGS84
source: Generated from the EIGEN-6C4 model by the ICGEM Calculat...
license: Creative Commons Attribution 4.0 International Licence
references: https://doi.org/10.5880/icgem.2015.1
long_name: gravity acceleration
description: magnitude of the gravity acceleration vector (gravitatio...
units: mGal
actual_range: [974748.6 980201.9]
icgem_metadata: generating_institute: gfz-potsdam\ngenerating_date: 2021... 9.801e+05 9.801e+05 9.801e+05 ... 9.802e+05 9.802e+05 9.802e+05
array([[980106.5 , 980106.5 , 980106.5 , ..., 980106.5 , 980106.5 ,
        980106.5 ],
       [980108.25, 980108.25, 980108.25, ..., 980108.25, 980108.25,
        980108.25],
       [980108.8 , 980108.8 , 980108.8 , ..., 980108.75, 980108.75,
        980108.8 ],
       ...,
       [980153.8 , 980153.75, 980153.6 , ..., 980153.94, 980153.8 ,
        980153.8 ],
       [980160.44, 980160.44, 980160.44, ..., 980160.44, 980160.44,
        980160.44],
       [980157.5 , 980157.5 , 980157.5 , ..., 980157.5 , 980157.5 ,
        980157.5 ]], dtype=float32)
Coordinates: (3)
longitude
(longitude)
float64
-180.0 -179.8 ... 179.8 180.0
long_name : longitude standard_name : longitude units : degrees_east actual_range : [-180. 180.] array([-180. , -179.833333, -179.666667, ..., 179.666667, 179.833333,
180. ]) latitude
(latitude)
float64
-90.0 -89.83 -89.67 ... 89.83 90.0
long_name : latitude standard_name : latitude units : degrees_north actual_range : [-90. 90.] array([-90. , -89.833333, -89.666667, ..., 89.666667, 89.833333,
90. ]) height
(latitude, longitude)
float32
1e+04 1e+04 1e+04 ... 1e+04 1e+04
long_name : geometric height standard_name : height_above_reference_ellipsoid description : height of gravity computation points above the WGS84 ellipsoid units : m actual_range : [10000. 10000.] array([[10000., 10000., 10000., ..., 10000., 10000., 10000.],
[10000., 10000., 10000., ..., 10000., 10000., 10000.],
[10000., 10000., 10000., ..., 10000., 10000., 10000.],
...,
[10000., 10000., 10000., ..., 10000., 10000., 10000.],
[10000., 10000., 10000., ..., 10000., 10000., 10000.],
[10000., 10000., 10000., ..., 10000., 10000., 10000.]],
dtype=float32) Attributes: (11)
Conventions : CF-1.8 title : Gravity acceleration (EIGEN-6C4) at a constant geometric height crs : WGS84 source : Generated from the EIGEN-6C4 model by the ICGEM Calculation Service (http://icgem.gfz-potsdam.de) license : Creative Commons Attribution 4.0 International Licence references : https://doi.org/10.5880/icgem.2015.1 long_name : gravity acceleration description : magnitude of the gravity acceleration vector (gravitational + centrifugal) units : mGal actual_range : [974748.6 980201.9] icgem_metadata : generating_institute: gfz-potsdam
generating_date: 2021/06/11
product_type: gravity_field
body: earth
modelname: EIGEN-6C4
max_used_degree: 720
gentlecut: 540 to 720
tide_system: tide_free
functional: gravity_ell (centrifugal term included)
unit: mgal
refsysname: WGS84
gmrefpot: 3.98600441800E+14 m**3/s**2
radiusrefpot: 6378137.000 m
flatrefpot: 3.352810664747480E-03 (1/298.25722356300)
omegarefpot: 7.29211500000E-05 1/s
long_lat_unit: degree
latlimit_north: 90.000000000000
latlimit_south: -90.000000000000
longlimit_west: -180.00000000000
longlimit_east: 180.00000000000
gridstep: 0.16666666666667
height_over_ell: 10000.0000 m
latitude_parallels: 1081
longitude_parallels: 2161
number_of_gridpoints: 2336041
gapvalue: 9999999.0000
weighted_mean: 9.7667904E+05 mgal
maxvalue: 9.8020189E+05 mgal
minvalue: 9.7474860E+05 mgal
signal_wrms: 1.5468191E+03 mgal
grid_format: long_lat_value
attributes: longitude latitude gravity_ell
attributes_units: deg. deg. mgal