<xarray.DataArray 'geoid' (latitude: 1081, longitude: 2161)>
array([[-29.5 , -29.5 , -29.5 , ..., -29.5 , -29.5 ,
-29.5 ],
[-29.5 , -29.5 , -29.5 , ..., -29.5 , -29.5 ,
-29.5 ],
[-29.6 , -29.6 , -29.6 , ..., -29.6 , -29.6 ,
-29.6 ],
...,
[ 14.7 , 14.7 , 14.7 , ..., 14.7 , 14.7 ,
14.7 ],
[ 15.2 , 15.2 , 15.2 , ..., 15.2 , 15.2 ,
15.2 ],
[ 15.400001, 15.400001, 15.400001, ..., 15.400001, 15.400001,
15.400001]], dtype=float32)
Coordinates:
* longitude (longitude) float64 -180.0 -179.8 -179.7 ... 179.7 179.8 180.0
* latitude (latitude) float64 -90.0 -89.83 -89.67 -89.5 ... 89.67 89.83 90.0
Attributes:
Conventions: CF-1.8
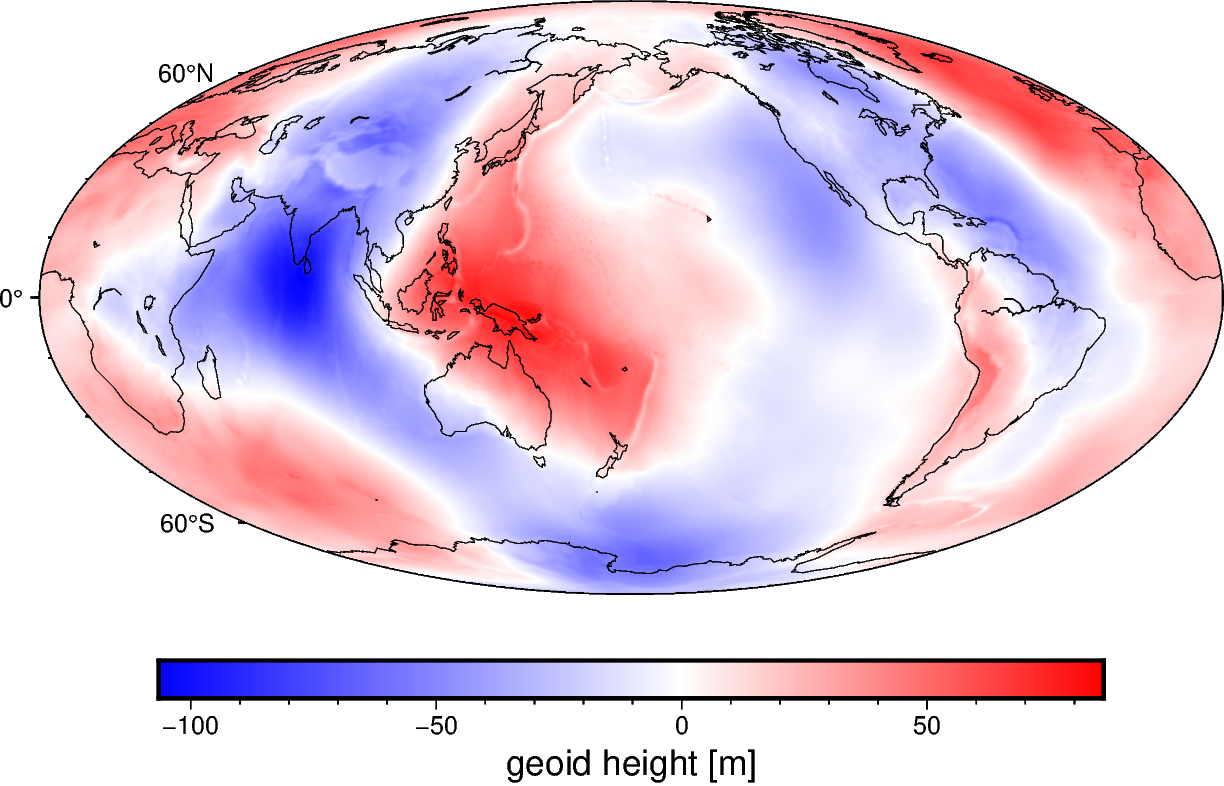
title: Geoid height (EIGEN-6C4) with respect to WGS84
crs: WGS84
source: Generated from the EIGEN-6C4 model by the ICGEM Calculat...
license: Creative Commons Attribution 4.0 International Licence
references: https://doi.org/10.5880/icgem.2015.1
long_name: geoid height
standard_name: geoid_height_above_reference_ellipsoid
description: height of the geoid with respect to the WGS84 ellipsoid
units: m
actual_range: [-106.5 86. ]
icgem_metadata: generating_institute: gfz-potsdam\ngenerating_date: 2021... -29.5 -29.5 -29.5 -29.5 -29.5 -29.5 ... 15.4 15.4 15.4 15.4 15.4 15.4
array([[-29.5     , -29.5     , -29.5     , ..., -29.5     , -29.5     ,
        -29.5     ],
       [-29.5     , -29.5     , -29.5     , ..., -29.5     , -29.5     ,
        -29.5     ],
       [-29.6     , -29.6     , -29.6     , ..., -29.6     , -29.6     ,
        -29.6     ],
       ...,
       [ 14.7     ,  14.7     ,  14.7     , ...,  14.7     ,  14.7     ,
         14.7     ],
       [ 15.2     ,  15.2     ,  15.2     , ...,  15.2     ,  15.2     ,
         15.2     ],
       [ 15.400001,  15.400001,  15.400001, ...,  15.400001,  15.400001,
         15.400001]], dtype=float32)
Coordinates: (2)
Attributes: (12)
Conventions : CF-1.8 title : Geoid height (EIGEN-6C4) with respect to WGS84 crs : WGS84 source : Generated from the EIGEN-6C4 model by the ICGEM Calculation Service (http://icgem.gfz-potsdam.de) license : Creative Commons Attribution 4.0 International Licence references : https://doi.org/10.5880/icgem.2015.1 long_name : geoid height standard_name : geoid_height_above_reference_ellipsoid description : height of the geoid with respect to the WGS84 ellipsoid units : m actual_range : [-106.5 86. ] icgem_metadata : generating_institute: gfz-potsdam
generating_date: 2021/06/11
product_type: gravity_field
body: earth
modelname: EIGEN-6C4
max_used_degree: 720
gentlecut: 540 to 720
tide_system: tide_free
functional: geoid
zero_degree_term: included
unit: meter
crust_density: 2670.0 kg/m**3
refsysname: WGS84
gmrefpot: 3.98600441800E+14 m**3/s**2
radiusrefpot: 6378137.000 m
flatrefpot: 3.352810664747480E-03 (1/298.25722356300)
omegarefpot: 7.29211500000E-05 1/s
normal_potential: 6.263685171456948E+07 m**2/s**2
long_lat_unit: degree
latlimit_north: 90.000000000000
latlimit_south: -90.000000000000
longlimit_west: -180.00000000000
longlimit_east: 180.00000000000
gridstep: 0.16666666666667
latitude_parallels: 1081
longitude_parallels: 2161
number_of_gridpoints: 2336041
gapvalue: 999.0000
weighted_mean: -5.2816814E-02 meter
maxvalue: 8.5964166E+01 meter
minvalue: -1.0652440E+02 meter
signal_wrms: 3.0591615E+01 meter
grid_format: long_lat_value
attributes: longitude latitude geoid
attributes_units: deg. deg. meter