<xarray.DataArray 'topography' (latitude: 1081, longitude: 2161)>
array([[ 2742., 2742., 2742., ..., 2742., 2742., 2742.],
[ 2768., 2768., 2768., ..., 2768., 2768., 2768.],
[ 2822., 2822., 2821., ..., 2822., 2822., 2822.],
...,
[-4243., -4244., -4245., ..., -4242., -4243., -4243.],
[-4156., -4157., -4157., ..., -4156., -4156., -4156.],
[-4237., -4237., -4237., ..., -4237., -4237., -4237.]],
dtype=float32)
Coordinates:
* longitude (longitude) float64 -180.0 -179.8 -179.7 ... 179.7 179.8 180.0
* latitude (latitude) float64 -90.0 -89.83 -89.67 -89.5 ... 89.67 89.83 90.0
Attributes:
Conventions: CF-1.8
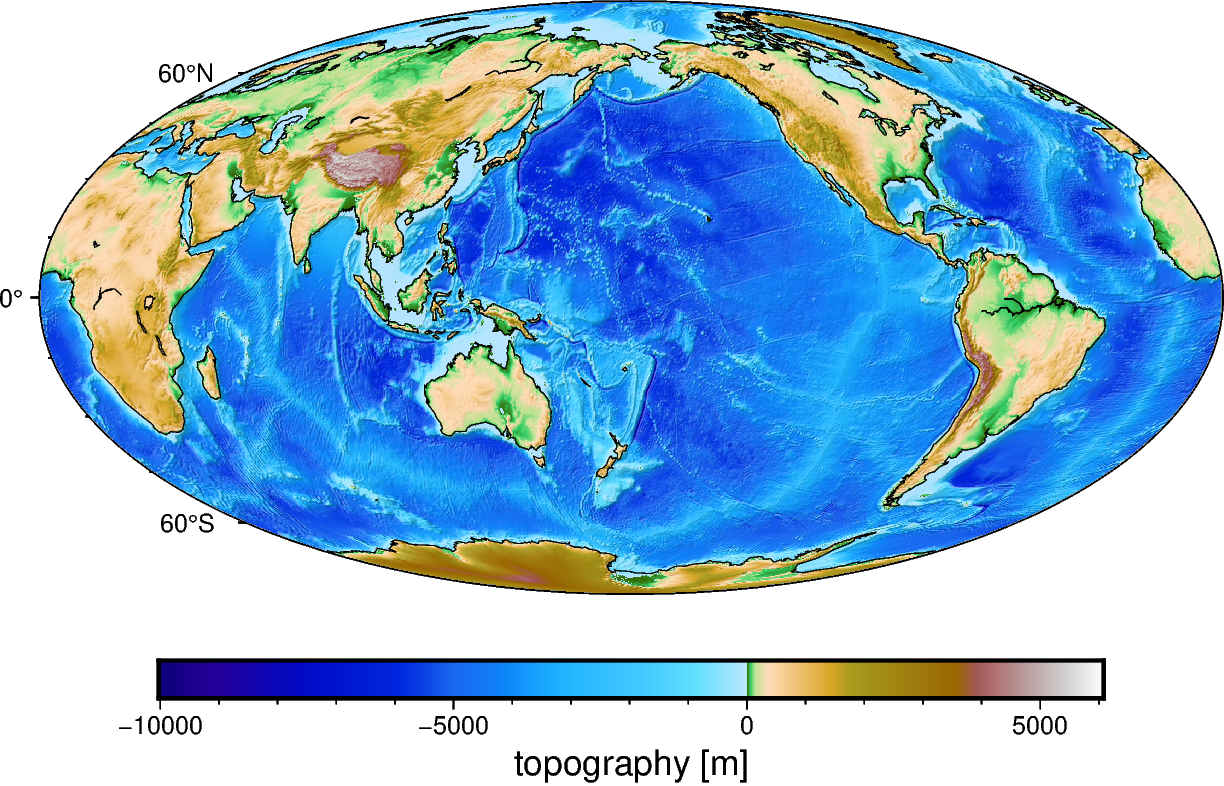
title: Topographic and bathymetric height of ETOPO1 (ice surfac...
crs: WGS84
source: Generated from a spherical harmonic model by the ICGEM C...
license: public domain
references: https://doi.org/10.7289/V5C8276M
long_name: topographic height above mean sea level
standard_name: height_above_mean_sea_level
description: height topography/bathymetry referenced to mean sea level
units: m
actual_range: [-10023. 6082.]
icgem_metadata: generating_institute: gfz-potsdam\ngenerating_date: 2021... 2.742e+03 2.742e+03 2.742e+03 ... -4.237e+03 -4.237e+03 -4.237e+03
array([[ 2742.,  2742.,  2742., ...,  2742.,  2742.,  2742.],
       [ 2768.,  2768.,  2768., ...,  2768.,  2768.,  2768.],
       [ 2822.,  2822.,  2821., ...,  2822.,  2822.,  2822.],
       ...,
       [-4243., -4244., -4245., ..., -4242., -4243., -4243.],
       [-4156., -4157., -4157., ..., -4156., -4156., -4156.],
       [-4237., -4237., -4237., ..., -4237., -4237., -4237.]],
      dtype=float32)
Coordinates: (2)
Attributes: (12)
Conventions : CF-1.8 title : Topographic and bathymetric height of ETOPO1 (ice surface) at 10 arc-minute resolution crs : WGS84 source : Generated from a spherical harmonic model by the ICGEM Calculation Service (http://icgem.gfz-potsdam.de) license : public domain references : https://doi.org/10.7289/V5C8276M long_name : topographic height above mean sea level standard_name : height_above_mean_sea_level description : height topography/bathymetry referenced to mean sea level units : m actual_range : [-10023. 6082.] icgem_metadata : generating_institute: gfz-potsdam
generating_date: 2021/06/11
product_type: topography
body: earth
modelname: etopo1-2250
max_used_degree: 720
gentlecut: 540 to 720
functional: topography_shm (from shm)
unit: meter
refsysname: WGS84
radiusrefsys: 6378137.000 m
flatrefsys: 3.352810664747480E-03 (1/298.25722356300)
long_lat_unit: degree
latlimit_north: 90.000000000000
latlimit_south: -90.000000000000
longlimit_west: -180.00000000000
longlimit_east: 180.00000000000
gridstep: 0.16666666666667
latitude_parallels: 1081
longitude_parallels: 2161
number_of_gridpoints: 2336041
gapvalue: 99999.0000
weighted_mean: -2.3852244E+03 meter
maxvalue: 6.0816327E+03 meter
minvalue: -1.0023309E+04 meter
signal_wrms: 2.5003302E+03 meter
grid_format: long_lat_value
attributes: longitude latitude topography_shm
attributes_units: deg. deg. meter