verde.datasets.setup_rio_magnetic_map
-
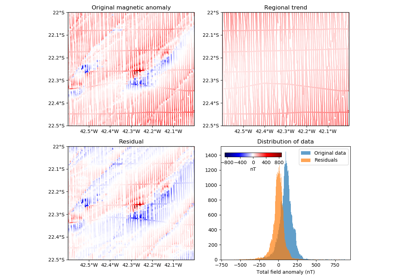
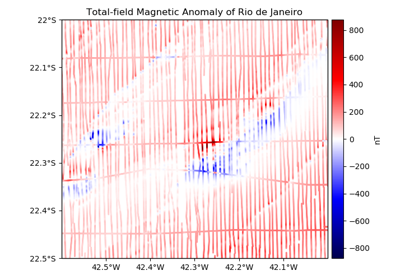
verde.datasets.setup_rio_magnetic_map(ax, region=(-42.6, -42, -22.5, -22))[source]¶ Setup a Cartopy map for the Rio de Janeiro magnetic anomaly dataset.
Parameters: - ax : matplotlib Axes
The axes where the map is being plotted.
- region : list = [W, E, S, N]
The boundaries of the map region in the coordinate system of the data.
- land : str or None
The name of the color of the land feature or None to omit it.
- ocean : str or None
The name of the color of the ocean feature or None to omit it.
See also
fetch_rio_magnetic- Sample magnetic anomaly data from Rio de Janeiro, Brazil.