Note
Click here to download the full example code
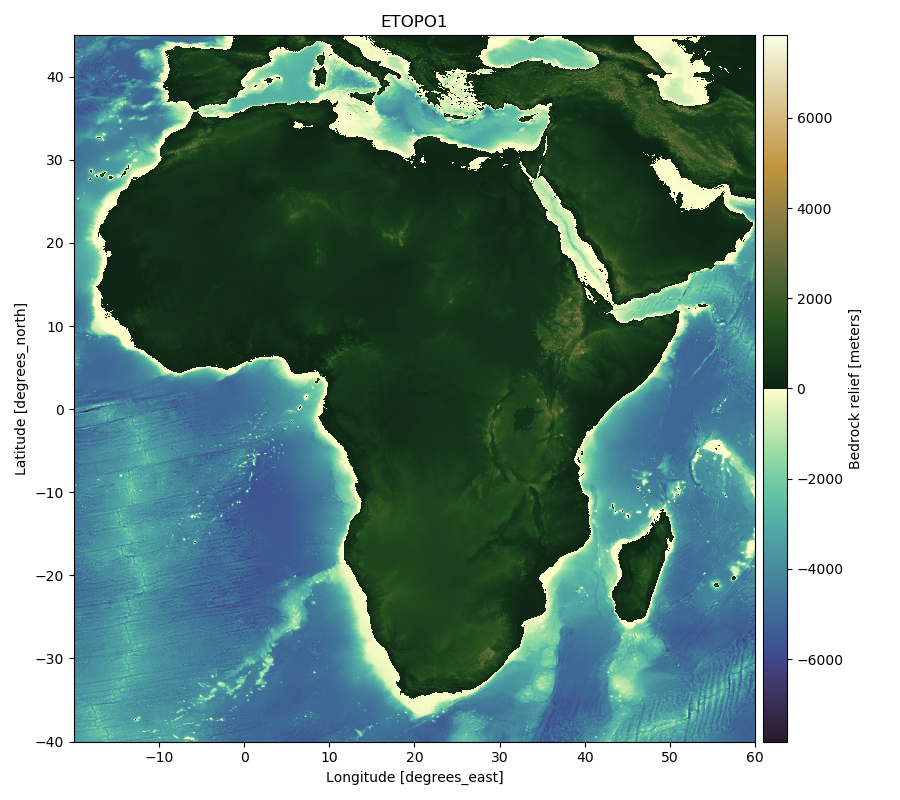
ETOPO1 Earth Relief
ETOPO1 is a 1 arc-minute global relief model of Earth’s surface that integrates
land topography and ocean bathymetry [AmanteEakins2009]. It’s available in two
versions: “Ice Surface” (top of Antarctic and Greenland ice sheets) and
“Bedrock” (base of the ice sheets). The grids are loaded into
xarray.Dataset which can be used to plot and make computations.
Out:
<xarray.Dataset>
Dimensions:    (latitude: 10801, longitude: 21601)
Coordinates:
  * longitude  (longitude) float64 -180.0 -180.0 -180.0 ... 180.0 180.0 180.0
  * latitude   (latitude) float64 -90.0 -89.98 -89.97 ... 89.97 89.98 90.0
Data variables:
    bedrock    (latitude, longitude) float64 ...
Attributes:
    Conventions:  COARDS/CF-1.0
    title:        ETOPO1 Bedrock Relief
    GMT_version:  4.4.0
    node_offset:  0
    doi:          10.7289/V5C8276M
/home/santi/git/rockhound/examples/etopo1.py:33: UserWarning: Matplotlib is currently using agg, which is a non-GUI backend, so cannot show the figure.
  plt.show()
import rockhound as rh
import matplotlib.pyplot as plt
import cmocean

# Load a version of the topography grid
grid = rh.fetch_etopo1(version="bedrock")
print(grid)

# Select a subset that corresponds to Africa to make plotting faster given the
# size of the grid.
africa = grid.sel(latitude=slice(-40, 45), longitude=slice(-20, 60))

# Plot the age grid.
# We're not using a map projection to speed up the plotting but this NOT
# recommended.
plt.figure(figsize=(9, 8))
ax = plt.subplot(111)
africa.bedrock.plot.pcolormesh(
    cmap=cmocean.cm.topo, cbar_kwargs=dict(pad=0.01, aspect=30), ax=ax
)
ax.set_title("ETOPO1")
plt.tight_layout()
plt.show()
Total running time of the script: ( 0 minutes 40.339 seconds)