Note
Click here to download the full example code
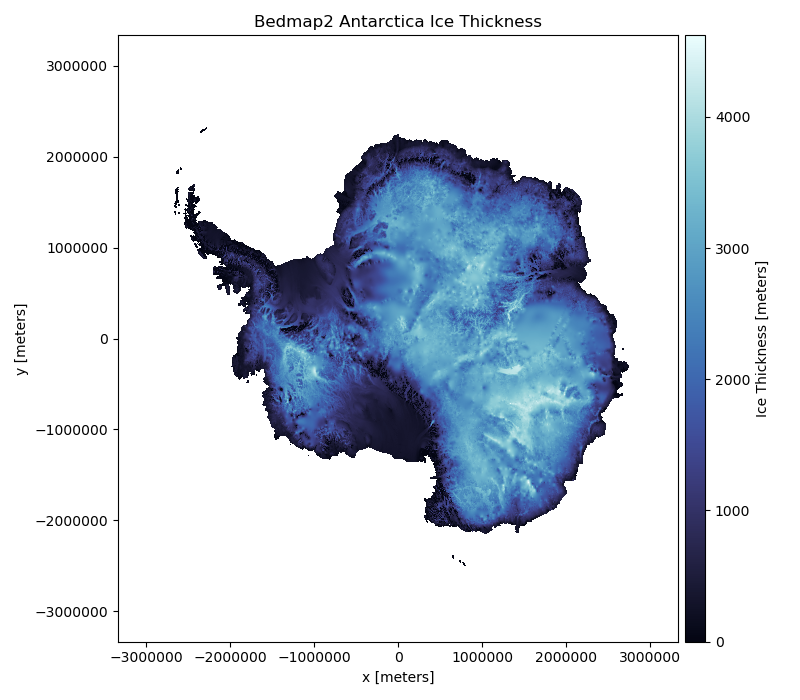
Bedmap2
Bedmap2 is a suite of gridded products describing surface elevation,
ice-thickness, the sea floor and subglacial bed elevation of the Antarctic
south of 60°S [BEDMAP2]. Each dataset is projected in Antarctic Polar
Stereographic projection, latitude of true scale -71 degrees south, datum
WGS84. All heights are in metres relative to sea level as defined by the g104c
geoid. The datasets are downloaded as tiff files and loaded into
a xarray.Dataset object.
Out:
<xarray.Dataset>
Dimensions:    (x: 6667, y: 6667)
Coordinates:
  * y          (y) float64 3.333e+06 3.332e+06 ... -3.332e+06 -3.333e+06
  * x          (x) float64 -3.333e+06 -3.332e+06 ... 3.332e+06 3.333e+06
Data variables:
    thickness  (y, x) float64 dask.array<chunksize=(1000, 1000), meta=np.ndarray>
Attributes:
    title:                Bedmap2
    projection:           Antarctic Polar Stereographic
    true_scale_latitude:  -71
    datum:                WGS84
    EPSG:                 3031
    doi:                  10.5194/tc-7-375-2013
/home/santi/git/rockhound/examples/bedmap2.py:28: UserWarning: Matplotlib is currently using agg, which is a non-GUI backend, so cannot show the figure.
  plt.show()
import rockhound as rh
import matplotlib.pyplot as plt
import cmocean

# Load the ice thickness grid
bedmap = rh.fetch_bedmap2(datasets=["thickness"])
print(bedmap)

plt.figure(figsize=(8, 7))
ax = plt.subplot(111)
pc = bedmap.thickness.plot.pcolormesh(
    ax=ax, cmap=cmocean.cm.ice, cbar_kwargs=dict(pad=0.01, aspect=30)
)
ax.set_title("Bedmap2 Antarctica Ice Thickness")
plt.tight_layout()
plt.show()
Total running time of the script: ( 0 minutes 48.593 seconds)