Note
Click here to download the full example code
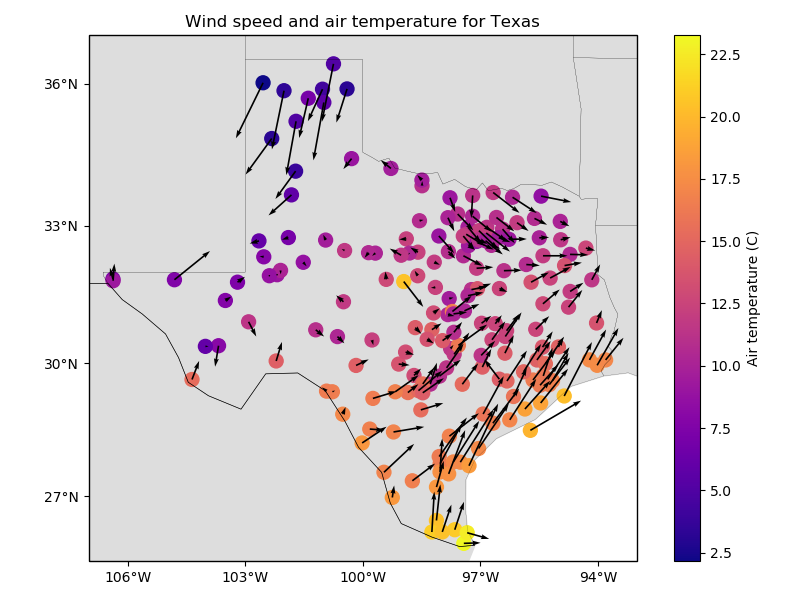
Wind speed data from Texas
This is average wind speed and air temperature for data for the state of Texas, USA, on February 26 2018. The original data was downloaded from Iowa State University.
Out:
station_id           ...            wind_speed_north_knots
0        0F2           ...                         -2.357185
1        11R           ...                          2.982564
2        2F5           ...                         -0.311412
3        3T5           ...                          3.018448
4        5C1           ...                          1.090743

[5 rows x 6 columns]
import matplotlib.pyplot as plt
import cartopy.crs as ccrs
import verde as vd


# The data are in a pandas.DataFrame
data = vd.datasets.fetch_texas_wind()
print(data.head())

# Make a Mercator map of the data using Cartopy
plt.figure(figsize=(8, 6))
ax = plt.axes(projection=ccrs.Mercator())
ax.set_title("Wind speed and air temperature for Texas")
# Plot the air temperature as colored circles and the wind speed as vectors.
plt.scatter(
    data.longitude,
    data.latitude,
    c=data.air_temperature_c,
    s=100,
    cmap="plasma",
    transform=ccrs.PlateCarree(),
)
plt.colorbar().set_label("Air temperature (C)")
ax.quiver(
    data.longitude.values,
    data.latitude.values,
    data.wind_speed_east_knots.values,
    data.wind_speed_north_knots.values,
    width=0.003,
    transform=ccrs.PlateCarree(),
)
# Use an utility function to add tick labels and land and ocean features to the map.
vd.datasets.setup_texas_wind_map(ax)
plt.tight_layout()
plt.show()
Total running time of the script: ( 0 minutes 0.109 seconds)