Loading a Dataset#
Loading data is a fundamental step in any data analysis or modeling workflow. The raw data must be accessed in a consistent, reliable, and reproducible manner. In this example, we use Ensaio to fetch a dataset containing microscopy measurements of a speleothem, ensuring both accessibility and data integrity.
What is Ensaio?
Ensaio serves as a reliable source for sharing reproducible research data in geophysics, providing persistent URLs and metadata for each dataset. The datasets in Ensaio are stored on platforms like Figshare or Zenodo, and each one includes a unique SHA256 has to ensure file integrity.
To load a dataset, the data is fetched using Ensaio as and read with Magali as an DataArray:
import magali as mg
import ensaio

fname = ensaio.fetch_morroco_speleothem_qdm(version=1, file_format="matlab")
bz = mg.read_qdm_harvard(fname)
What is DataArray?
A DataArray is the core data structure in xarray, similar to a labeled N-dimensional NumPy array. It includes:
data: the actual array values
dims: names of dimensions
coords: coordinate labels for each dimension
attrs: metadata
Inspecting the Data#
To understand its structure and content, it’s helpful to inspect its dimensions, coordinates, and metadata:
print(bz) # Summary view
<xarray.DataArray 'bz' (y: 600, x: 960)> Size: 5MB
array([[ 352.40587477,   94.8913792 ,   41.61924299, ...,  470.18833933,
         129.20055397,   18.50120941],
       [ 525.04809649,  624.84659897,   53.45418   , ...,  450.42515609,
         240.12455308,  -73.61367693],
       [ 105.0939369 ,  638.76559489,  307.60736872, ...,  236.91326522,
         386.8498122 ,  -86.44215589],
       ...,
       [ -83.74367957,   32.98078244, -411.75073652, ...,  745.99373583,
        1036.20033954, -140.64317643],
       [ 171.17113661, -214.47801235,  159.23437984, ...,  124.58138395,
         258.54331931,  -90.3376945 ],
       [  80.60950354,  273.08367487,  118.23499313, ...,   -4.19572521,
         -53.55728012,    2.10335918]], shape=(600, 960))
Coordinates:
  * y        (y) float64 5kB 0.0 2.35 4.7 7.05 ... 1.403e+03 1.405e+03 1.408e+03
  * x        (x) float64 8kB 0.0 2.35 4.7 7.05 ... 2.249e+03 2.251e+03 2.254e+03
    z        (y, x) float64 5MB 5.0 5.0 5.0 5.0 5.0 5.0 ... 5.0 5.0 5.0 5.0 5.0
Attributes:
    long_name:  vertical magnetic field
    units:      nT
As you can see, the DataArray corresponds to the vertical magnetic field, which was measured in nT and has x, y and z coordinates.
We can also check the coordinates units:
print(bz.x.units)
print(bz.y.units)
print(bz.z.units)
µm
µm
µm
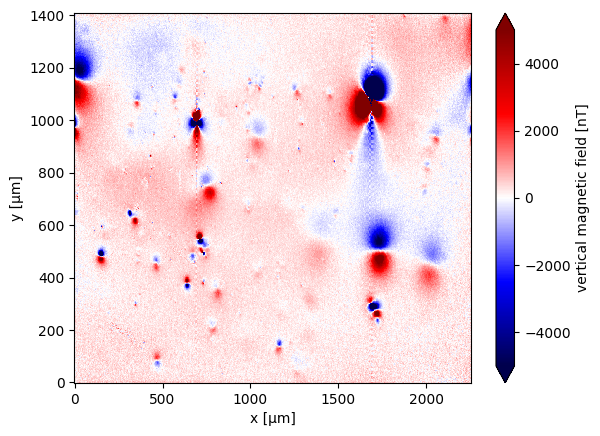
Plotting the Data#
Finally, the data is plotted:
bz.plot.pcolormesh(cmap="seismic", vmin=-5000, vmax=5000)
<matplotlib.collections.QuadMesh at 0x7faec891cc50>