Note
Click here to download the full example code
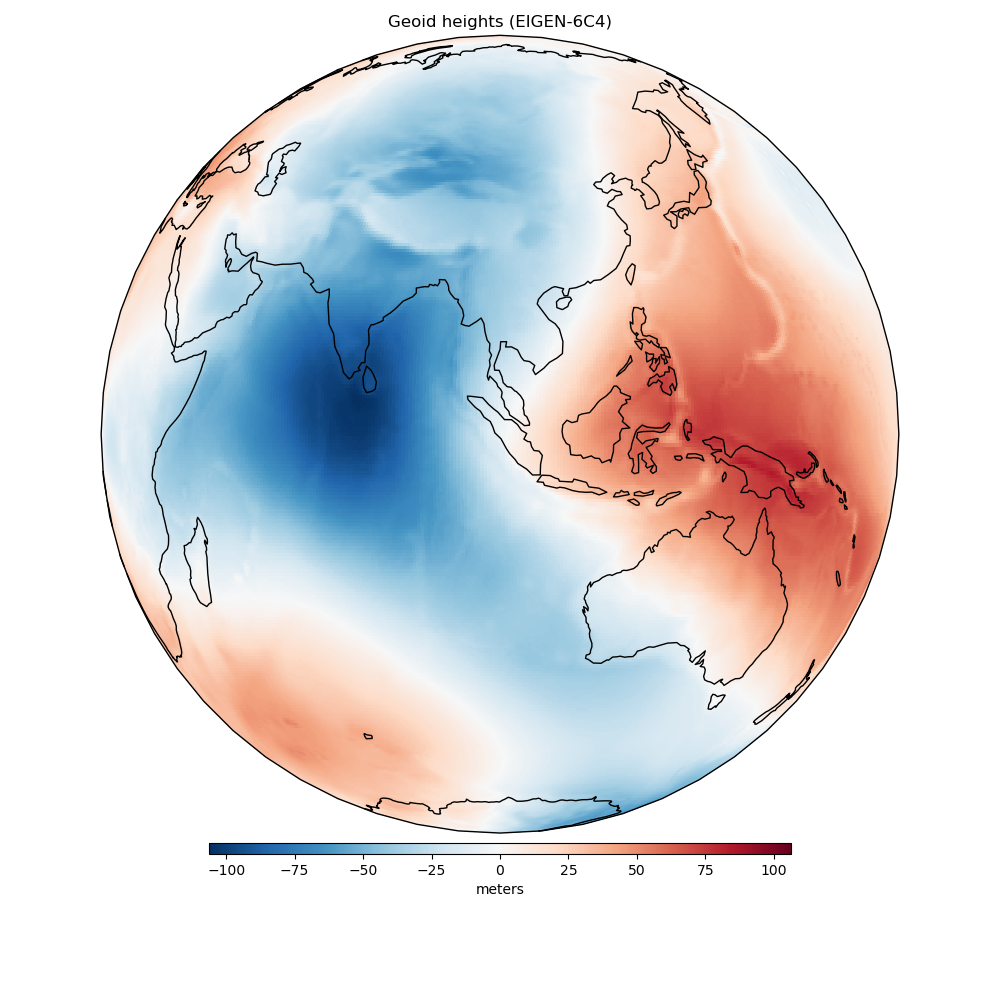
Earth Geoid
The geoid is the equipotential surface of the Earth’s gravity potential that coincides with mean sea level. It’s often represented by “geoid heights”, which indicate the height of the geoid relative to the reference ellipsoid (WGS84 in this case). Negative values indicate that the geoid is below the ellipsoid surface and positive values that it is above. The data are on a regular grid with 0.5 degree spacing and was generated from the spherical harmonic model EIGEN-6C4 [Forste_etal2014].
Out:
<xarray.Dataset>
Dimensions:    (latitude: 361, longitude: 721)
Coordinates:
  * longitude  (longitude) float64 -180.0 -179.5 -179.0 ... 179.0 179.5 180.0
  * latitude   (latitude) float64 -90.0 -89.5 -89.0 -88.5 ... 89.0 89.5 90.0
Data variables:
    geoid      (latitude, longitude) float64 -29.5 -29.5 -29.5 ... 15.37 15.37
import matplotlib.pyplot as plt
import cartopy.crs as ccrs
import harmonica as hm

# Load the geoid grid
data = hm.datasets.fetch_geoid_earth()
print(data)

# Make a plot of data using Cartopy
plt.figure(figsize=(10, 10))
ax = plt.axes(projection=ccrs.Orthographic(central_longitude=100))
pc = data.geoid.plot.pcolormesh(ax=ax, transform=ccrs.PlateCarree(), add_colorbar=False)
plt.colorbar(
    pc, label="meters", orientation="horizontal", aspect=50, pad=0.01, shrink=0.6
)
ax.set_title("Geoid heights (EIGEN-6C4)")
ax.coastlines()
plt.tight_layout()
plt.show()
Total running time of the script: ( 0 minutes 0.477 seconds)