Note
Click here to download the full example code
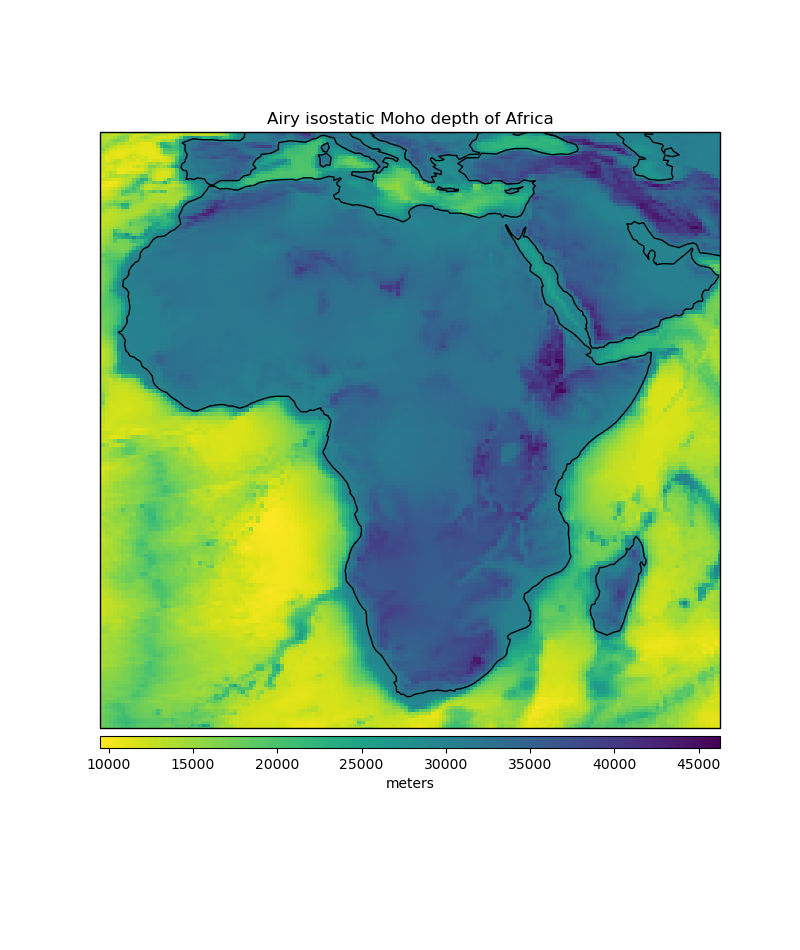
Airy Isostasy
According to the Airy hypothesis of isostasy, topography above sea level is
supported by a thickening of the crust (a root) while oceanic basins are
supported by a thinning of the crust (an anti-root). Function
harmonica.isostasy_airy computes the depth to crust-mantle interface
(the Moho) according to Airy isostasy. One must assume a value for the
reference thickness of the continental crust in order to convert the
root/anti-root thickness into Moho depth. The function contains common default
values for the reference thickness and crust, mantle, and water densities
[TurcotteSchubert2014].
We’ll use our sample topography data
(harmonica.datasets.fetch_topography_earth) to calculate the Airy
isostatic Moho depth of Africa.
Out:
Topography/bathymetry grid:
<xarray.Dataset>
Dimensions:     (latitude: 171, longitude: 161)
Coordinates:
  * longitude   (longitude) float64 -20.0 -19.5 -19.0 -18.5 ... 59.0 59.5 60.0
  * latitude    (latitude) float64 -40.0 -39.5 -39.0 -38.5 ... 44.0 44.5 45.0
Data variables:
    topography  (latitude, longitude) float64 -3.523e+03 -3.392e+03 ... 29.0

Moho depth grid:
<xarray.DataArray 'moho_depth' (latitude: 171, longitude: 161)>
array([[17317.2, 17788.8, 17968.8, ..., 11485.2, 11402.4, 11186.4],
       [17526. , 17947.2, 18487.2, ..., 11121.6, 11118. , 11056.8],
       [17259.6, 17742. , 18411.6, ..., 10952.4, 11096.4, 11082. ],
       ...,
       [14898. , 13508.4, 13116. , ..., 30229.6, 30207.2, 30218.4],
       [14901.6, 13947.6, 13346.4, ..., 30184.8, 30162.4, 30162.4],
       [14887.2, 14361.6, 13627.2, ..., 30207.2, 30184.8, 30162.4]])
Coordinates:
  * longitude  (longitude) float64 -20.0 -19.5 -19.0 -18.5 ... 59.0 59.5 60.0
  * latitude   (latitude) float64 -40.0 -39.5 -39.0 -38.5 ... 44.0 44.5 45.0
Attributes:
    isostasy:         Airy
    density_crust:    2800.0
    density_mantle:   3300.0
    density_water:    1000.0
    reference_depth:  30000.0
/home/travis/build/fatiando/harmonica/examples/isostasy_airy.py:47: UserWarning: Tight layout not applied. The left and right margins cannot be made large enough to accommodate all axes decorations.
  plt.tight_layout()
import matplotlib.pyplot as plt
import cartopy.crs as ccrs
import harmonica as hm

# Load the elevation model and cut out the portion of the data corresponding to
# Africa
data = hm.datasets.fetch_topography_earth()
region = (-20, 60, -40, 45)
data_africa = data.sel(latitude=slice(*region[2:]), longitude=slice(*region[:2]))
print("Topography/bathymetry grid:")
print(data_africa)

# Calculate the isostatic Moho depth using the default values for densities and
# reference Moho
moho = hm.isostasy_airy(data_africa.topography)
print("\nMoho depth grid:")
print(moho)

# Draw the maps
plt.figure(figsize=(8, 9.5))
ax = plt.axes(projection=ccrs.LambertCylindrical(central_longitude=20))
pc = moho.plot.pcolormesh(
    ax=ax, cmap="viridis_r", add_colorbar=False, transform=ccrs.PlateCarree()
)
plt.colorbar(pc, ax=ax, orientation="horizontal", pad=0.01, aspect=50, label="meters")
ax.coastlines()
ax.set_title("Airy isostatic Moho depth of Africa")
ax.set_extent(region, crs=ccrs.PlateCarree())
plt.tight_layout()
plt.show()
Total running time of the script: ( 0 minutes 0.223 seconds)