Overview#
The main purpose of Bordado is to facilitate generating coordinates for
evenly spaced points.
These could be the coordinates of a regular grid, of points along a line, or of
a profile.
While you could do a lot of this with a combination of numpy.linspace
and numpy.meshgrid, there are a few problems that Bordado solves:
What if I want to specify the spacing between points instead of how many points?
What if the spacing isn’t exactly a multiple of the interval?
What was the order of arguments to
numpy.meshgridand what’s the difference between the difference indexing types?What if I want points along a straight line or great circle between two points?
On top of that, Bordado also offers other utilities like splitting points into blocks and rolling windows, calculating some nearest neighbor statistics, and more.
Let’s see how it works!
Importing the package#
Everything in Bordado is available through the bordado module. There are
no submodules to import. We’ll usually alias the import to bd:
import bordado as bd
Checkout the “List of functions and classes (API)” for a full list of all that Bordado offers.
Generating evenly spaced values#
Let’s say we want to generate values between 0 and 10 with an interval of 0.5.
We can use function bordado.line_coordinates to do this by doing some
maths to figure out that we need 21 points for this (don’t forget the extra one
because of the end point):
values = bd.line_coordinates(0, 10, size=21)
print(values)
[ 0.   0.5  1.   1.5  2.   2.5  3.   3.5  4.   4.5  5.   5.5  6.   6.5
  7.   7.5  8.   8.5  9.   9.5 10. ]
Or we could pass the spacing argument to line_coordinates
instead and let Bordado do the maths:
values = bd.line_coordinates(0, 10, spacing=0.5)
print(values)
[ 0.   0.5  1.   1.5  2.   2.5  3.   3.5  4.   4.5  5.   5.5  6.   6.5
  7.   7.5  8.   8.5  9.   9.5 10. ]
We can also optionally generate values at the middle of the 0.5 wide cells
instead of at their borders by passing the pixel_register argument:
values_pixel = bd.line_coordinates(0, 10, spacing=0.5, pixel_register=True)
print(values_pixel)
[0.25 0.75 1.25 1.75 2.25 2.75 3.25 3.75 4.25 4.75 5.25 5.75 6.25 6.75
 7.25 7.75 8.25 8.75 9.25 9.75]
Notice that when using pixel-registration, there will be one less value because we’re calculating the number of intervals instead of the number of borders:
print(values.size, values_pixel.size)
21 20
Another benefit of using Bordado is that it will automatically adjust the spacing to make it fit the given interval:
values = bd.line_coordinates(0, 10, spacing=0.6)
print(values)
[ 0.          0.58823529  1.17647059  1.76470588  2.35294118  2.94117647
  3.52941176  4.11764706  4.70588235  5.29411765  5.88235294  6.47058824
  7.05882353  7.64705882  8.23529412  8.82352941  9.41176471 10.        ]
This way, you can provide an approximate spacing that you desire without having to calculate the exact spacing that would be a multiple of your interval. But if the spacing is important and must be preserved, we can ask Bordado do adjust the interval (we call it a region) instead:
values = bd.line_coordinates(0, 10, spacing=0.6, adjust="region")
print(values)
[-0.1  0.5  1.1  1.7  2.3  2.9  3.5  4.1  4.7  5.3  5.9  6.5  7.1  7.7
  8.3  8.9  9.5 10.1]
This same logic also applies to multidimensional sets of values or coordinates, for example those belonging to regular grids.
Regular grids#
Function bordado.grid_coordinates combines
line_coordinates to generate sets of coordinates for grids.
For example, this is how we generate coordinates for a 2D grid:
coordinates = bd.grid_coordinates((0, 10, -5, 5), spacing=2)
for i, c in enumerate(coordinates):
    print(f"coordinate {i}:")
    print(c)
coordinate 0:
[[ 0.  2.  4.  6.  8. 10.]
 [ 0.  2.  4.  6.  8. 10.]
 [ 0.  2.  4.  6.  8. 10.]
 [ 0.  2.  4.  6.  8. 10.]
 [ 0.  2.  4.  6.  8. 10.]
 [ 0.  2.  4.  6.  8. 10.]]
coordinate 1:
[[-5. -5. -5. -5. -5. -5.]
 [-3. -3. -3. -3. -3. -3.]
 [-1. -1. -1. -1. -1. -1.]
 [ 1.  1.  1.  1.  1.  1.]
 [ 3.  3.  3.  3.  3.  3.]
 [ 5.  5.  5.  5.  5.  5.]]
The first argument to grid_coordinates is called a region
in Bordado and it specifies the boundaries of the domain which contains the
grid.
Hint
The region will always have an even number of elements. Each pair is the minimum and maximum value along a dimension of the grid. In our example, the first coordinate is between 0 and 10 and the send between -5 and 5.
The coordinates are returned as a tuple of numpy arrays that have
dimensions compatible with the number of elements in the region.
We can make multidimensional grids by adding more elements to the region:
coordinates = bd.grid_coordinates((0, 9, -3, 3, 6, 12), spacing=3)
for i, c in enumerate(coordinates):
    print(f"coordinate {i}:")
    print(c)
    print()
coordinate 0:
[[[0. 3. 6. 9.]
  [0. 3. 6. 9.]
  [0. 3. 6. 9.]]

 [[0. 3. 6. 9.]
  [0. 3. 6. 9.]
  [0. 3. 6. 9.]]

 [[0. 3. 6. 9.]
  [0. 3. 6. 9.]
  [0. 3. 6. 9.]]]

coordinate 1:
[[[-3. -3. -3. -3.]
  [ 0.  0.  0.  0.]
  [ 3.  3.  3.  3.]]

 [[-3. -3. -3. -3.]
  [ 0.  0.  0.  0.]
  [ 3.  3.  3.  3.]]

 [[-3. -3. -3. -3.]
  [ 0.  0.  0.  0.]
  [ 3.  3.  3.  3.]]]

coordinate 2:
[[[ 6.  6.  6.  6.]
  [ 6.  6.  6.  6.]
  [ 6.  6.  6.  6.]]

 [[ 9.  9.  9.  9.]
  [ 9.  9.  9.  9.]
  [ 9.  9.  9.  9.]]

 [[12. 12. 12. 12.]
  [12. 12. 12. 12.]
  [12. 12. 12. 12.]]]
Just like with line_coordinates, we can pass a spacing that
isn’t exactly a multiple of the dimensions of the region:
coordinates = bd.grid_coordinates((0, 10, -5, 5), spacing=2.6)
for i, c in enumerate(coordinates):
    print(f"coordinate {i}:")
    print(c)
coordinate 0:
[[ 0.   2.5  5.   7.5 10. ]
 [ 0.   2.5  5.   7.5 10. ]
 [ 0.   2.5  5.   7.5 10. ]
 [ 0.   2.5  5.   7.5 10. ]
 [ 0.   2.5  5.   7.5 10. ]]
coordinate 1:
[[-5.  -5.  -5.  -5.  -5. ]
 [-2.5 -2.5 -2.5 -2.5 -2.5]
 [ 0.   0.   0.   0.   0. ]
 [ 2.5  2.5  2.5  2.5  2.5]
 [ 5.   5.   5.   5.   5. ]]
And we can also adjust the region instead of the spacing:
coordinates = bd.grid_coordinates(
    (0, 10, -5, 5), spacing=2.6, adjust="region",
)
for i, c in enumerate(coordinates):
    print(f"coordinate {i}:")
    print(c)
coordinate 0:
[[-0.2  2.4  5.   7.6 10.2]
 [-0.2  2.4  5.   7.6 10.2]
 [-0.2  2.4  5.   7.6 10.2]
 [-0.2  2.4  5.   7.6 10.2]
 [-0.2  2.4  5.   7.6 10.2]]
coordinate 1:
[[-5.2 -5.2 -5.2 -5.2 -5.2]
 [-2.6 -2.6 -2.6 -2.6 -2.6]
 [ 0.   0.   0.   0.   0. ]
 [ 2.6  2.6  2.6  2.6  2.6]
 [ 5.2  5.2  5.2  5.2  5.2]]
Bordado also offers a lot more than generating coordinates. Let’s see how we can use it to split points as well.
Splitting into blocks#
Bordado has function bordado.block_split that can provide indices for
segmenting coordinate arrays according to spatial blocks.
For example, let’s make some random coordinates with
bordado.random_coordinates and then divide them into blocks of a given
size:
coordinates = bd.random_coordinates(
    (20, 30, -50, -44), size=500, random_seed=42,
)
Note
The coordinates is a tuple with two 1d-arrays, one for each coordinate
of our 2-dimensional region.
Then we can use block_split to get the indexers that split
these points into evenly sized blocks:
block_coordinates, labels = bd.block_split(coordinates, block_size=2)
print(labels)
[13 12 14  8  5 14  3 13  5  2  1 14  3  4  7  1  2 10  4 13 13  6  4  9
  3  5 12 10 10  3 13 14  6  6  2  0  5  2  1 13 12  9 13 11  4  9  6  1
 13  5  5  0  3 13  3  3  2  7  5  5  3  2 12  8  8 12 12  1  5  7  6 12
  9 11 10  6 11  8 12  8  8  7  4  5 10  5  3  7  0  2 10  8  2  6  1  3
 11  5 10  9  9 13 11 14 13 13 12  1 10  9  7  5 11 12  0 14 13  8  2  3
 12  8 10  7 10  7 11  0  5 12 10 14  2  6  2  0 14 12 13 10 12 12  4  2
  7 11  1  7 12  0  9 14 10  2 10  8 11  3  8  8  0 14  1  0  7 11 14 14
  1  9  1  7 11 14  5  5 12  9  4  8  4  4  2  6  8  8  6 10 13  6  4 11
  0  4 10  5 12  9  5  1  3  4  2 10  0  6 10 13  5  7 13 12 10 14 13  3
  5  0  9 11  6  7  3 14  1  4  0  2  8  5  0  2  4  7  4 14  2  3  5  5
  4  3 11  2  8  9  3  7 11 12  3  4  2  6 11  3  4 10  0  7 10  4  1  0
 14  0  1  0  0  5  0  5  5 12  3 11  6  2 14 14  0 10  6  6 12  7 10  1
 12  5  4  5  4  0  4  9  4  4 13 13 13  0 12  7  4  2 11  3  6 10  2  2
 11  6  1 11 11  8  6  4  4  7  1  7 14  3  9  2 13  1  8  5  8 14 10  8
 10 13  5  9  0 14  9  7  3 13  9 11  2 10  3  0 12 12  2  7 13 13  7  7
 14 10 10  5  3 12 13 13  1  4 13  1 11  6 10 10  9  2  6  8  7  9 13  7
  1  9  8  4  0 14  8 10  2  3 10 12  4  1  2  7  6  4  3  5 14  9  6  4
  0  4 13 13 10 14 10 11  0  3  0  9  3 10  5  5  3  4  1 14  5 14  4  8
  8 14 10  0 10  2 13  3  4 10  3  5  6  3 14 13 10  8  5  4  3  0 10 10
 14  7  8  8  7  5  4  1 12  8 13  4  5  2  2  2  0 10  1  6  7  8  8  2
 12 11 12  6  0 12  7  1  7 12  8 13 13  1 13  7  7  3 11  2]
The labels are the number of the block to which each point belongs. For example, these are the coordinates of the points that fall inside block 1:
for c in coordinates:
    print(c[labels==1])
[23.70798024 22.27238722 22.26909349 22.88328104 23.03950098 23.01512089
 22.72241562 23.31568997 22.30213991 23.17138893 22.90917838 23.10323673
 22.86446227 23.10334674 22.84720082 23.73614138 23.6639245  23.28361205
 22.88155614 23.33637758 22.70534941 23.76359473 22.95359025 22.38552821
 23.01342633 22.78075546 22.25592868 23.16214152]
[-49.56764512 -48.96203333 -49.00455879 -49.5197043  -49.65134911
 -49.95611326 -49.31537557 -49.97299925 -48.87443791 -48.22182766
 -49.17907233 -48.20370025 -49.3819839  -49.71575588 -48.87006815
 -48.08960529 -49.23854015 -48.23146884 -48.47801296 -49.40082514
 -49.86115943 -48.81954692 -48.78747139 -49.03812785 -49.24601688
 -48.07080205 -49.69935986 -48.72827233]
The block_coordinates is a tuple with the coordinates of the center of each
block:
for c in block_coordinates:
    print(c)
[[21.04797324 23.03532303 25.02267282 27.01002262 28.99737241]
 [21.04797324 23.03532303 25.02267282 27.01002262 28.99737241]
 [21.04797324 23.03532303 25.02267282 27.01002262 28.99737241]]
[[-48.99509132 -48.99509132 -48.99509132 -48.99509132 -48.99509132]
 [-47.0000707  -47.0000707  -47.0000707  -47.0000707  -47.0000707 ]
 [-45.00505009 -45.00505009 -45.00505009 -45.00505009 -45.00505009]]
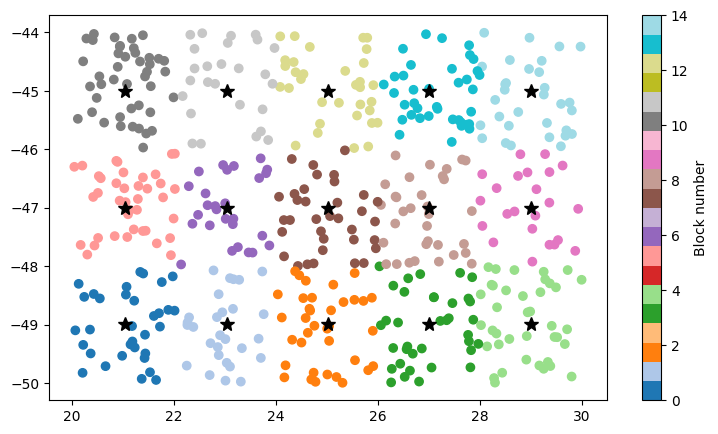
Let’s use matplotlib to plot this so we can understand it better. We’ll
plot the block centers as stars and a scatter of the points colored according
to which block they belong:
import matplotlib.pyplot as plt

fig, ax = plt.subplots(1, 1, figsize=(9, 5))
tmp = ax.scatter(coordinates[0], coordinates[1], c=labels, cmap="tab20")
fig.colorbar(tmp, label="Block number")
ax.plot(block_coordinates[0], block_coordinates[1], "*k", markersize=10)
plt.show()
See also
The keen-eyed among you might have noticed that the coordinates of the block
centers are not spaced by 2 (the block size). This is because by default
block_split extracts the region that is divided into blocks
from the input data, which are random and there are no points exactly on the
region boundaries. You can pass a region argument to make this be exact
if desired.
Explore the rest!#
That’s a brief overview of the functionality in Bordado but there’s plenty more! Have a look at the “List of functions and classes (API)” and the documentation for each function.
If you have any questions, please ask on any of the Fatiando a Terra community channels! We’re also always looking for more people to get involved in the development. Leave us a message if that’s you.
Oh, and don’t forget to cite Bordado if you use it in a publication!