Note
Click here to download the full example code
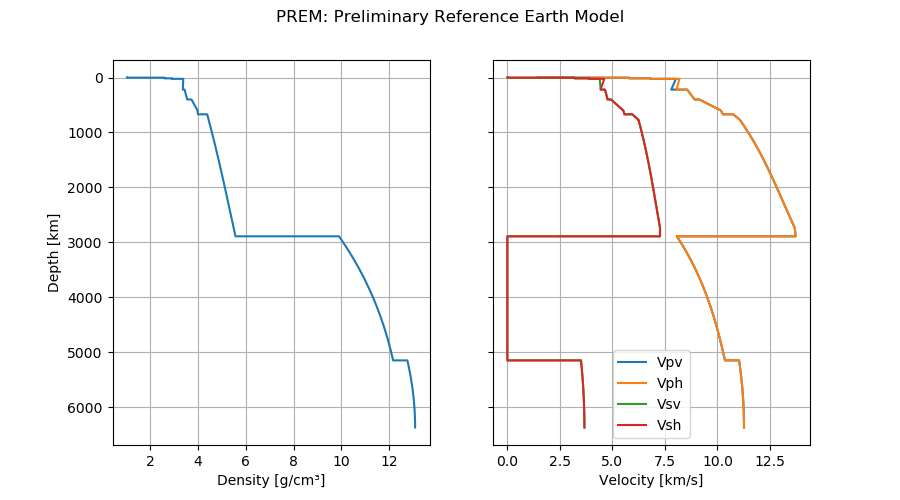
PREM: Preliminary Reference Earth Model
The Preliminary reference Earth model (PREM) [Dziewonsky1981] is
a one-dimensional model representing the average Earth properties as a function
of planetary radius. The model includes the depth, density, seismic
velocities, attenuation (Q) and anisotropic parameter (\(\eta\)) on the
boundaries of several Earth layers. The data is loaded into
pandas.DataFrame objects, which can be used to plot and make
computations.
Out:
     radius   depth   density       Vpv       Vph      Vsv      Vsh  eta   Q_mu  Q_kappa
0    6371.0     0.0   1.02000   1.45000   1.45000  0.00000  0.00000  1.0    0.0  57823.0
1    6370.0     1.0   1.02000   1.45000   1.45000  0.00000  0.00000  1.0    0.0  57823.0
2    6369.0     2.0   1.02000   1.45000   1.45000  0.00000  0.00000  1.0    0.0  57823.0
3    6368.0     3.0   1.02000   1.45000   1.45000  0.00000  0.00000  1.0    0.0  57823.0
4    6368.0     3.0   2.60000   5.80000   5.80000  3.20000  3.20000  1.0  600.0  57823.0
..      ...     ...       ...       ...       ...      ...      ...  ...    ...      ...
194   400.0  5971.0  13.05366  11.23711  11.23711  3.65027  3.65027  1.0   84.6   1327.7
195   300.0  6071.0  13.06890  11.24809  11.24809  3.65794  3.65794  1.0   84.6   1327.7
196   200.0  6171.0  13.07979  11.25593  11.25593  3.66342  3.66342  1.0   84.6   1327.7
197   100.0  6271.0  13.08632  11.26063  11.26063  3.66670  3.66670  1.0   84.6   1327.7
198     0.0  6371.0  13.08850  11.26220  11.26220  3.66780  3.66780  1.0   84.6   1327.7

[199 rows x 10 columns]
/home/santi/git/rockhound/examples/prem.py:35: UserWarning: Matplotlib is currently using agg, which is a non-GUI backend, so cannot show the figure.
  plt.show()
import rockhound as rh
import matplotlib.pyplot as plt

# Load PREM into a DataFrame
prem = rh.fetch_prem()
print(prem)

# Plot density and velocities
fig, axes = plt.subplots(1, 2, figsize=(9, 5), sharey=True)
fig.suptitle("PREM: Preliminary Reference Earth Model")
ax = axes[0]
prem.plot("density", "depth", legend=False, ax=ax)
ax.invert_yaxis()
ax.set_xlabel("Density [g/cm³]")
ax.set_ylabel("Depth [km]")
ax.grid()
ax = axes[1]
for velocity in ["Vpv", "Vph", "Vsv", "Vsh"]:
    prem.plot(velocity, "depth", legend=False, ax=ax, label=velocity)
ax.grid()
ax.legend()
ax.set_xlabel("Velocity [km/s]")
plt.show()
Total running time of the script: ( 0 minutes 0.617 seconds)