Getting started
This is a sample tutorial page.
Start by importing stuff.
import matplotlib.pyplot as plt
import numpy as np
Create some random data.
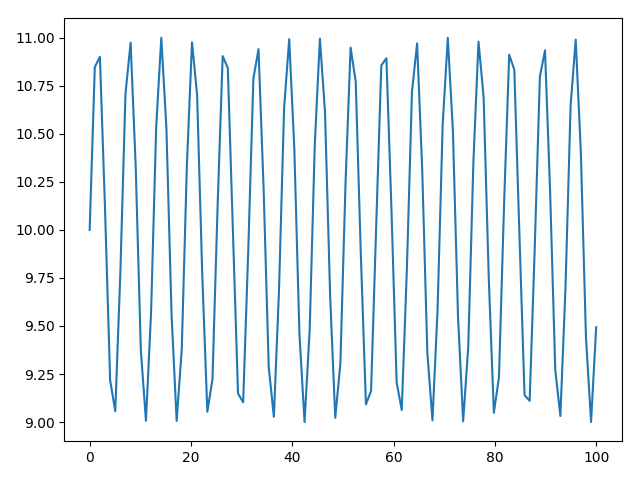
x = np.linspace(0, 100, 100)
y = np.sin(x) + 10
print(x, y)
Out:
[   0.            1.01010101    2.02020202    3.03030303    4.04040404
    5.05050505    6.06060606    7.07070707    8.08080808    9.09090909
   10.1010101    11.11111111   12.12121212   13.13131313   14.14141414
   15.15151515   16.16161616   17.17171717   18.18181818   19.19191919
   20.2020202    21.21212121   22.22222222   23.23232323   24.24242424
   25.25252525   26.26262626   27.27272727   28.28282828   29.29292929
   30.3030303    31.31313131   32.32323232   33.33333333   34.34343434
   35.35353535   36.36363636   37.37373737   38.38383838   39.39393939
   40.4040404    41.41414141   42.42424242   43.43434343   44.44444444
   45.45454545   46.46464646   47.47474747   48.48484848   49.49494949
   50.50505051   51.51515152   52.52525253   53.53535354   54.54545455
   55.55555556   56.56565657   57.57575758   58.58585859   59.5959596
   60.60606061   61.61616162   62.62626263   63.63636364   64.64646465
   65.65656566   66.66666667   67.67676768   68.68686869   69.6969697
   70.70707071   71.71717172   72.72727273   73.73737374   74.74747475
   75.75757576   76.76767677   77.77777778   78.78787879   79.7979798
   80.80808081   81.81818182   82.82828283   83.83838384   84.84848485
   85.85858586   86.86868687   87.87878788   88.88888889   89.8989899
   90.90909091   91.91919192   92.92929293   93.93939394   94.94949495
   95.95959596   96.96969697   97.97979798   98.98989899  100.        ] [ 10.          10.84688556  10.90070545  10.11106004   9.2174125
   9.05661874   9.77925403  10.7086068   10.97438499  10.32770071
   9.37414122   9.00666696   9.56939907  10.53536727  10.99999098
  10.5281735    9.56174814   9.00572357   9.38078881  10.33571414
  10.97626009  10.70258763   9.77097723   9.05383513   9.22272878
  10.11949778  10.90436313  10.84233795   9.9915057    9.14862793
   9.10301723   9.89738572  10.78784731  10.94052958  10.21245326
   9.28542516   9.02756042   9.68033637  10.63246122  10.99231798
  10.42291893   9.4574776    9.00008117   9.47905837  10.44587117
  10.99514807  10.61251892   9.65629665   9.02193525   9.30348224
  10.23728303  10.94888021  10.77189886   9.8720731    9.09204444
   9.16227044  10.01698798  10.85579714  10.89319537  10.09416112
   9.20694972   9.06238997   9.79585479  10.72049132  10.97042401
  10.31160349   9.36098199   9.00876868   9.58479358  10.54963839
  10.99977452  10.51367217   9.54654169   9.00405209   9.39421755
  10.35166777  10.97979883  10.69039764   9.75447382   9.04847291
   9.2335292   10.13634679  10.91148248  10.83306073   9.97451956
   9.13983954   9.11065647   9.91429883  10.79819602  10.93462283
  10.19582243   9.27364418   9.03166158   9.69647914  10.6455287
  10.99007314  10.40746394   9.44328528   9.00044192   9.49363436]
Make the plot.
plt.figure()
plt.plot(x, y)
plt.tight_layout()
plt.show()
Total running time of the script: ( 0 minutes 0.206 seconds)