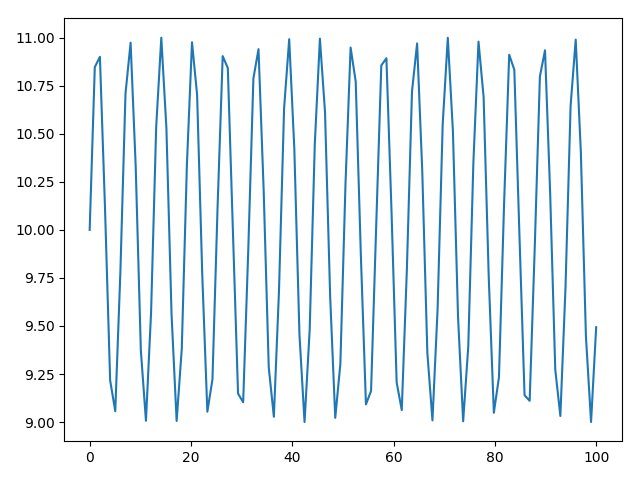
This is a sample gallery plot.
Out:
10
import matplotlib.pyplot as plt
import numpy as np

from geometric import Sphere


sphere = Sphere(center=[1, 2, 3], radius=10, density=10)
print(sphere.density)

x = np.linspace(0, 100, 100)
y = np.sin(x) + 10

plt.figure()
plt.plot(x, y)
plt.tight_layout()
plt.show()
Total running time of the script: ( 0 minutes 0.214 seconds)
Generated by Sphinx-Gallery